Introduction
Velocity analysis stands at the core of axial turbine design, determining whether an aerospace engine delivers its rated thrust, a power plant achieves target efficiency, or a marine propulsion system meets performance specifications. For turbomachinery engineers, velocity triangles are the practical language that translates fluid momentum into shaft work.
Many engineers struggle with selecting the right stage configuration for specific operating conditions, optimizing blade-to-gas speed ratios without validated benchmarks, and predicting how velocity changes translate to actual work extraction.
A NASA two-stage axial turbine design initially allocated 2.98 Btu/lb per stage based on velocity triangle analysis. Those calculations directly shaped hardware specs across aerospace, power generation, and marine propulsion.
This article breaks down velocity triangle fundamentals, compares impulse and reaction stage characteristics, and offers optimization guidance grounded in verified design data.
Key Takeaways
- Velocity triangles link absolute, relative, and blade speeds—and set stage work output
- Impulse stages drop pressure in nozzles; reaction stages split expansion across stator and rotor
- Optimum blade-to-gas speed ratio is ~0.48 for single-row impulse stages (varies with flow angles)
- Stage efficiency hinges on reaction, speed ratio, blade profile, and sealing—not one parameter alone
Understanding Axial Flow Turbines
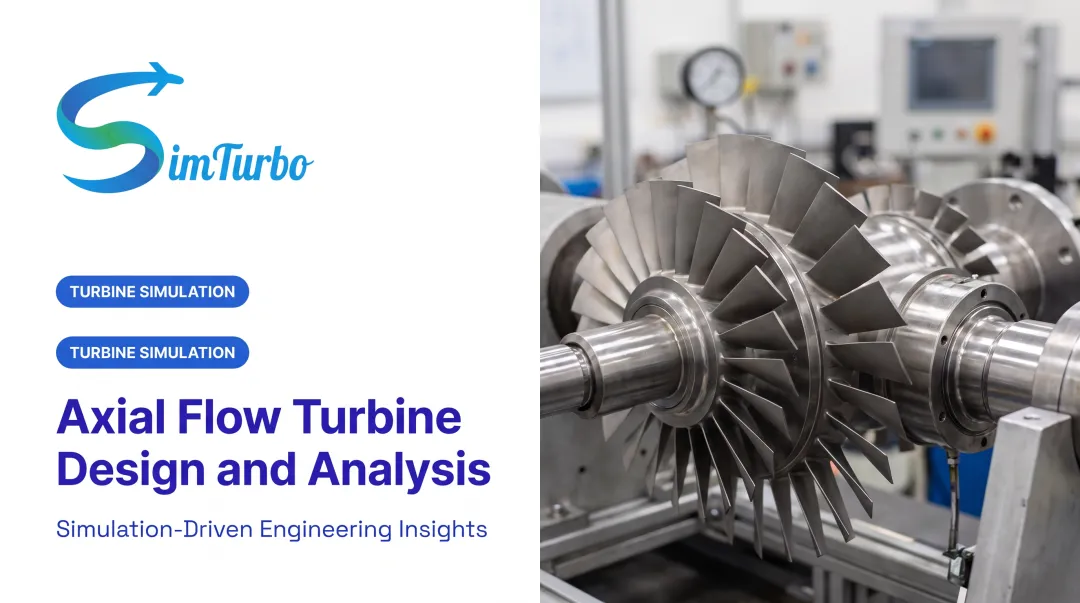
Axial flow turbines extract energy from fluid flowing approximately parallel to the shaft axis. This distinguishes them from radial turbines, where flow moves perpendicular to the rotation axis. ASME treats axial-flow and radial-flow turbine aerodynamics as distinct architectures, each suited to different pressure ratios, flow rates, and geometric constraints.
Core Components:
- Stator (nozzle) vanes: Stationary blade rows that convert internal energy into kinetic energy and add tangential velocity (swirl) to the flow
- Rotor blades: Rotating rows mounted on the shaft that extract work by removing swirl from the fluid
- Shaft: Transmits torque produced by the rotor to external loads
Energy transfer occurs through changes in fluid momentum and angular velocity. MIT identifies the stator as a no-work blade row that accelerates the flow and introduces swirl. The rotor then extracts shaft work by removing that tangential momentum.
Work Extraction Principle:
The Euler turbine equation ties those velocity changes to work. At constant mean radius, shaft work per unit mass equals blade speed times the change in tangential absolute velocity. In a turbine, torque and angular velocity have opposite signs; in a compressor, they align.
Velocity Triangles in Axial Turbines
Stage Velocity Triangle Components
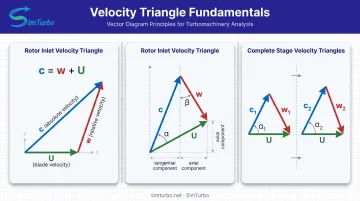
Velocity triangles are vector diagrams showing the geometric relationships between three velocity components at rotor inlet and outlet:
- Absolute velocity (c or V) - Fluid velocity measured in the stationary frame
- Relative velocity (w or W) - Fluid velocity measured in the rotating blade frame
- Blade velocity (U) - Tangential speed of the rotor at a given radius
Vector Relationship:
The fundamental relation is c = w + U. At rotor inlet and outlet, tangential components relate as w_θ = c_θ - U, where θ denotes the tangential (whirl) direction.
Angle Notation:
- α (alpha) - Absolute flow angle measured from the axial direction
- β (beta) - Relative flow angle measured from the axial direction
Velocity Components:
Each velocity splits into axial and tangential components:
- Axial:
c_x = c·cos(α)andw_x = w·cos(β) - Tangential:
c_θ = c·sin(α)andw_θ = w·sin(β)
Constant Axial Velocity Assumption:
Many mean-line analyses assume c_x = constant through the stage, so c_1·cos(α_1) = c_2·cos(α_2) = w_2·cos(β_2).
MIT applies this simplification "for purposes of illustration." It is not a universal design law. Density changes and annulus area variations can invalidate it in real machines.
Velocity Triangle Analysis for Energy Transfer
Those same triangles feed the Euler equation and set stage work. For a turbine stage at constant mean radius, work per unit mass depends on blade speed and the change in absolute tangential velocity at rotor inlet and outlet:
Work per unit mass = U(c_θ,in - c_θ,out)
The swirl change sets torque. Larger swirl reduction across the rotor means higher work extraction for a given blade speed.
Practical Example:
MIT Problem T16 specifies a rotor inlet with c₂ = 400 m/s at α₂ = 70° for both impulse and reaction triangle calculations.
NASA's two-stage turbine initially divided work equally at 2.98 Btu/lb per stage from the velocity diagrams. Testing showed the split became 53/47 in practice.
Engineers use velocity triangles to:
- Set blade angles to achieve target work extraction
- Predict rotor inlet and exit swirl
- Identify potential separation or shock losses
- Balance loading across multiple stages
Single-Stage Impulse Turbines
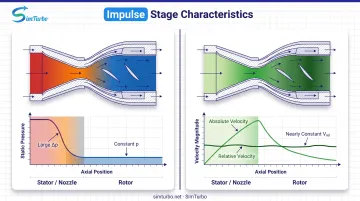
Impulse stages concentrate the pressure drop in the stationary nozzle while ideally holding static pressure constant across the rotor:
- Nozzle accelerates the flow and adds swirl
- Rotor redirects flow with minimal pressure change
- Degree of reaction R = 0 (ideally)
For an ideal impulse stage with symmetric rotor blade angles (β₂ = -β₃), the tangential components of relative velocity entering and leaving the rotor have equal magnitudes: |w_θ,in| = |w_θ,out|. MIT impulse-triangle notes treat that symmetry as a standard analysis assumption.
Velocity through the stage behaves as follows:
- Nozzle: Absolute velocity increases as pressure drops
- Rotor: Absolute velocity falls as kinetic energy becomes shaft work; relative speed stays nearly constant (friction trims it slightly)
Per ASME stage-design work, impulse stages allow higher work extraction per stage than reaction designs, so they suit layouts that need fewer stages.
Velocity-Compounded and Pressure-Compounded Stages
When a turbine must handle large pressure ratios, engineers face a choice: extract the energy through velocity compounding or pressure compounding.
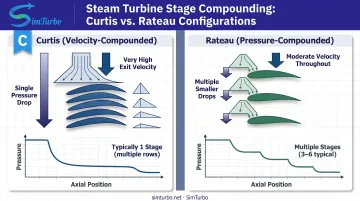
Velocity-Compounded Impulse Turbines (Curtis Stages)
Curtis stages convert a large pressure drop into high velocity in the nozzles, then extract that kinetic energy across multiple rotor rows with fixed guide blades between them.
Characteristics:
- Single high-expansion nozzle creates very high exit velocity
- Successive impulse rotor rows progressively remove kinetic energy
- Fixed guide blades redirect flow between rotors without adding work
Limitations:
- High velocities can require convergent-divergent nozzles
- Supersonic flow introduces shock losses
- Complex nozzle-rotor aerodynamic interactions beyond conventional performance predictions
- Lower efficiency than alternatives
Application:
Per ASME guidance on mechanical-drive steam turbines, velocity compounding is usually limited to the first control stage, where rapid load response justifies the efficiency penalty.
Pressure-Compounded Stages (Rateau Stages)
Rateau staging divides the total pressure drop across multiple simple impulse stages, each with its own nozzle and rotor.
Characteristics:
- Each stage handles a moderate pressure drop
- Velocities remain manageable, typically subsonic
- Simpler nozzle geometry (convergent only)
- More stages required for the same total expansion
Efficiency Advantage:
An ASME study found that replacing one Curtis stage with multiple Rateau stages raised overall efficiency by several points. Blade profile optimization in the same work added another 1–4 percentage points.
Velocity Triangle Comparison:
The velocity triangles make the tradeoff plain:
| Feature | Curtis | Rateau |
|---|---|---|
| Rotor inlet velocity | Very high after single nozzle | Moderate after each nozzle |
| Relative velocity change | Spread across multiple rotors | Approximately constant per rotor |
| Pressure distribution | Single large drop | Multiple moderate drops |
| Nozzle complexity | May require convergent-divergent | Convergent sufficient |
| Stage count | Fewer overall | More stages needed |
Reaction Stage Velocity Characteristics
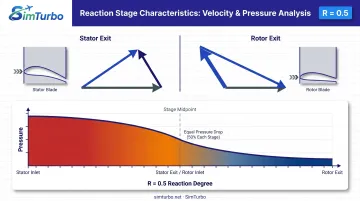
Reaction stages distribute pressure drop across both stator and rotor, causing continuous acceleration and velocity changes through the entire stage.
Degree of Reaction:
R = (rotor static enthalpy drop) / (stage static enthalpy drop)
When R = 0.5, the stator and rotor share the static enthalpy drop equally. Because pressure falls through the rotor, relative velocity magnitude generally increases, contrasting with the constant-relative-velocity ideal of impulse stages.
Velocity Triangle Differences:
Impulse stages keep symmetric tangential relative velocity (|w_θ,in| ≈ |w_θ,out|). Reaction stages produce asymmetric relative velocities because the flow expands in the rotor.
Measured Performance:
A NASA high-reaction single-stage turbine achieved 0.83 total rotor-exit efficiency at design blade-jet speed ratio 0.621, compared to design predictions of 0.849. Researchers traced performance shortfalls partly to rotor-tip region losses.
Efficiency vs. Leakage Trade-Off:
Reaction stages can offer aerodynamic advantages through better flow guidance and reduced turning per row. However, pressure drop across the rotor creates a tip-leakage driving force.
ASME research on degree of reaction shows that lower reaction shifts leakage toward the stationary hub seal, away from the shrouded rotating tip. Rotating-tip leakage can still dominate because stationary rows permit better sealing. Reaction becomes a coupled velocity-triangle and sealing decision.
Engineers select reaction degree based on:
- Desired loading per stage
- Available sealing technology
- Blade stress limits
- Cooling requirements (for gas turbines)
- Efficiency targets balanced against mechanical complexity
Blade-to-Gas Speed Ratio and Performance
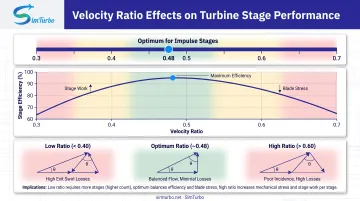
The blade-to-gas speed ratio (also called velocity ratio) drives stage efficiency and practical design choices.
Nozzle-Exit Definition:
σ = U / c₂
where U is blade speed at mean radius and c₂ is absolute velocity entering the rotor.
Isentropic Definition:
λ = U / c₀
where c₀ = √(2Δh_is) represents the isentropic velocity equivalent of the stage pressure drop. The pressure basis (total-to-static or total-to-total) must accompany any quoted value.
Optimum Values:
- Impulse stages: Texas A&M research shows about 0.48 for single-row Rateau stages. The common 0.47 value comes from U/c₂ = cos(α₂)/2 only near α₂ = 20°—it is not geometry-independent
- Reaction stages: Published optima near 0.7 lack primary-source verification and depend on angle choices and which definition of ratio is used
How Velocity Ratio Shapes Design:
Selecting velocity ratio simultaneously determines:
- Work per stage (higher ratio at fixed c₂ raises U and stage work)
- Blade incidence (off-design ratio shifts rotor inlet angles)
- Exit swirl and leaving losses
- How many stages you need for a given total expansion
Practical Implications:
For a fixed shaft speed and turbine diameter, c₂ sets the achievable velocity ratio. Too low a ratio cuts work per stage and forces more stages; too high risks blade stress limits.
Engineers iterate among velocity ratio, mean radius, rpm, and stage count until thermodynamic, aerodynamic, and mechanical constraints all line up.
Practical Design Applications
Velocity triangle analysis guides stage-type selection for specific applications across aerospace, power generation, and marine propulsion.
Steam Turbine Practice
ASME identifies a common pattern: velocity compounding (Curtis) limited to the first control stage for rapid throttle response, followed by Rateau or reaction stages for the remaining expansion. Siemens SST-200 industrial steam turbines follow that approach with reaction-blade technology on the downstream stages.
Aerospace Applications
High-pressure gas turbine stages are often impulse, but architecture still varies by mission and cycle. NASA selected two full-admission, 50%-reaction turbines for an advanced rocket-engine turbopump, showing reaction staging can work in high-pressure aerospace duty when the constraints favor it.
Marine Propulsion
GE's LM2500 gas turbine uses a two-stage high-pressure turbine and a six-stage power turbine. Spreading work across many stages keeps per-stage velocities in a manageable range—the same velocity-triangle logic that favors reaction staging when multistage efficiency matters more than minimizing stage count.
Its first marine installation powered the U.S. Navy's GTS Adm. Callaghan. The fleet has since accumulated more than 75 million combined operating hours.
Simulation Tools
Modern design platforms help engineers visualize velocity triangles, validate thermodynamic matching, and predict off-design performance.
SimTurbo supports that workflow with real-time views of transient behavior during startup and throttle changes. Engineers can track how RPM, temperature, pressure, and surge margin evolve, then check compressor/turbine matching on interactive maps for corrected mass flow, efficiency, and power.
Selection Criteria
| Application | Typical Choice | Rationale |
|---|---|---|
| Steam turbine control stage | Curtis (velocity-compounded) | Fast throttle response, acceptable efficiency penalty for one stage |
| Steam turbine following stages | Rateau or reaction | Higher efficiency, manageable velocities |
| High-work aerospace stages | Often impulse, but not universal | Minimize stage count, accept sealing and efficiency trade-offs |
| Marine and industrial power turbines | Frequently reaction | Multistage expansion, efficiency priority |
Losses, Efficiency, and Optimization Considerations
Velocity triangle analysis reveals where energy goes and guides loss-reduction strategies.
Major Loss Mechanisms:
- Profile (cascade) losses: boundary-layer friction and separation on blade surfaces
- Secondary-flow losses: three-dimensional vortices driven by endwall boundary layers
- Tip-clearance losses: leakage over blade tips and through seals
- Trailing-edge and mixing losses: wake mixing downstream of blade rows
- Leaving losses: kinetic energy left in the exit flow
A 2023 ASME axial turbine loss model calibrated on 228 cascades and validated on 15 stages reported an average stage-efficiency deviation of just 0.48%—evidence that modern loss-prediction methods are highly mature.
Measured Efficiency Benchmarks:
Case-specific data beats any fixed “percent of ideal work” assumption:
- NASA’s two-stage axial turbine: 0.845 rotor-exit total efficiency (stages: 0.864 and 0.805)
- NASA high-reaction single stage: 0.83 total efficiency vs. 0.849 design target
- NASA rocket-turbopump turbines: 79.0% and 86.1% predicted for primary and secondary units with reduced nozzle turning
Optimization Through Velocity Triangles:
Engineers use triangle analysis to:
- Minimize exit swirl and leaving losses by setting appropriate rotor exit angles
- Control incidence angles to avoid separation
- Distribute work and reaction across stages to balance loading
- Select velocity ratios that align with efficiency peaks
- Validate that Mach numbers remain within acceptable ranges
One NASA turbopump design selected reduced nozzle turning specifically to lower aerodynamic loss, showing how triangle geometry directly drives design decisions.
Practical Efficiency Strategy:
Modern turbine design couples velocity-triangle selection with profile optimization, reaction distribution, sealing improvements, and thermal management. Simulation tools such as SimTurbo let engineers test those triangle choices against steady-state and transient performance before hardware commits.
ASME reports that optimized blade profiles delivered 1–4 percentage-point efficiency gains in mechanical-drive steam turbines. Replacing Curtis stages with Rateau staging added several overall points on top of that.
Frequently Asked Questions
What is axial velocity in a turbine?
Axial velocity is the fluid velocity component parallel to the turbine shaft, typically denoted c_x. Simplified stage analyses often assume it stays constant through the blade rows, though real machines see density and area changes that break that assumption.
What is the difference between axial flow and centrifugal flow?
Axial-flow turbines move fluid parallel to the shaft axis, while centrifugal (radial) turbines move fluid perpendicular to it. Axial machines suit high mass-flow, moderate-pressure-ratio applications like large power turbines; radial machines fit lower-flow, higher-pressure-ratio scenarios such as turbochargers.
What is axial shift in a turbine?
Axial shift is the rotor's axial displacement along the shaft due to thrust forces, thermal expansion, or mechanical clearances. Thrust bearings maintain relative axial position; limited observable movement is sometimes called rotor float.
What is an axial flow reaction turbine?
An axial flow reaction turbine has R > 0, meaning part of the stage's static enthalpy drop occurs across the rotor. In a 50% reaction stage, stator and rotor share the pressure drop equally, causing continuous flow acceleration through both blade rows.
How do velocity triangles differ between impulse and reaction stages?
Ideal impulse stages show symmetric tangential relative velocity entering and leaving the rotor because static pressure remains constant. Reaction stages show changing relative velocities as the flow expands through the rotor, creating asymmetric triangles.
Why is the blade-to-gas speed ratio important in turbine design?
Velocity ratio fixes the velocity triangle for a given rotor inlet velocity, radius, and shaft speed. It sets stage work, blade incidence, exit swirl, and how many stages you need for a given expansion.