Introduction
Pressure ratio defines how efficiently a gas turbine compressor turns ambient air into high-energy working fluid. It is the core performance parameter engineers use in engine design and operation.
Teams rely on it to predict thrust, fuel consumption, and operability margins across the flight envelope—from sea-level startup to high-altitude cruise. Get the ratio wrong, and simulation results, control schedules, and performance margins drift off target.
This article covers the thermodynamic definition of pressure ratio, how to calculate it from absolute pressures, typical ranges by engine type, measurement approaches, and practical checks for simulation and real-world validation.
TL;DR
- Pressure ratio (PR) = compressor discharge total pressure ÷ inlet total pressure; it drives Brayton-cycle efficiency
- Real engines span roughly J85-21 CPR 8.3 to GE9X OPR 60—higher PR raises efficiency but adds complexity
- Compute PR = P2c/P1c from absolute total (stagnation) pressures; altitude, ram, throttle, and efficiency shift it
- Sets the compressor map operating point, predicts thrust and SFC, and protects surge margin
- Tools like SimTurbo support real-time PR analysis in transients and control-law validation
What Pressure Ratio Represents in Gas Turbine Systems
Pressure ratio in thermodynamic terms is the ratio of total (stagnation) pressure at compressor discharge to total pressure at compressor inlet. Total pressure accounts for both static pressure and the dynamic pressure contribution from flow velocity, making it the proper measure for energy availability in the working fluid.
The ICAO standard defines overall pressure ratio (OPR) as the mean compressor-discharge total pressure divided by mean compressor-entry total pressure, typically evaluated at takeoff thrust under ISA sea-level-static conditions.
Pressure ratio directly governs Brayton cycle thermal efficiency according to the ideal relationship η = 1 - (1/PR^((γ-1)/γ)), where γ is the specific heat ratio (approximately 1.4 for air). Higher pressure ratios permit larger expansion ratios and reduce the fraction of energy rejected to the atmosphere, raising ideal thermal efficiency.
That relationship assumes reversible adiabatic compression, constant-pressure heat addition, and constant specific heats. Real engines never meet those conditions. Actual efficiency depends on component losses, turbine inlet temperature limits, and compressor work requirements that rise with pressure ratio.
Pressure ratio functions as both a design parameter (the target value selected during cycle optimization) and an operating variable (measured and controlled in real time during engine operation). It changes with throttle position, altitude, flight speed, and component degradation.
Engineers distinguish between overall pressure ratio (OPR), which spans the entire compression system from inlet to combustor, and individual stage pressure ratios within multistage compressor assemblies. Manufacturer specifications, test data, and simulation results only line up when that distinction is clear.
Factors That Influence Pressure Ratio in Real-World Operation
Real engines operate far from the ideal isentropic assumptions underlying basic Brayton cycle equations. Actual pressure ratio is constrained by design choices, operating conditions, and degradation over service life.
Design constraints:
- Number of compressor stages and blade geometry define achievable pressure rise per stage
- Rotational speed limits set by mechanical stress, blade tip speed, and rotor dynamics
- Material allowables for compressor discharge temperature, which rises with pressure ratio according to Tt3/Tt2 = (pt3/pt2)^((γ-1)/γ)
- Compressor efficiency losses from flow separation, tip leakage, and shock waves at high Mach numbers
Inlet conditions:
- Ambient temperature and pressure decrease with altitude, lowering inlet absolute pressure
- Ram pressure rise from flight speed adds total pressure at the compressor inlet via P1c = P_ambient × [1 + ((γ-1)/2) × M²]^(γ/(γ-1))
- Inlet distortion, flow separation, or foreign object damage reduce effective inlet pressure and mass flow
Operating variables:
- Engine throttle setting controls corrected spool speed, which moves the operating point along the compressor map
- Transient acceleration or deceleration shifts the compressor toward or away from surge and choke boundaries
- Off-design operation away from the compressor's optimal efficiency point increases losses and reduces achievable pressure ratio
Degradation mechanisms:
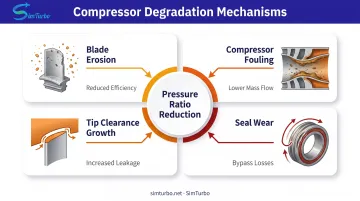
- Blade erosion from particulate ingestion reduces stage efficiency and pressure rise
- Compressor fouling from dirt, oil, or salt deposits blocks flow passages and lowers mass flow
- Tip clearance growth from thermal cycling and wear increases leakage losses
- Seal wear permits parasitic flows that bypass compression stages, effectively reducing pressure ratio over engine service life
Range of Pressure Ratio
Pressure ratio ranges reflect engine cycle design, compressor technology, and application requirements. Manufacturer and NASA benchmarks give concrete reference points across engine types.
Nominal Operating Range by Engine Type
Documented design-point overall pressure ratios include:
| Engine type | Documented example | Condition and source |
|---|---|---|
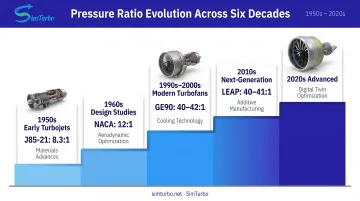
| Early turbojet | J85-21: 8.30 | 100% design speed, NASA TM 1980 |
| 1950s design study | NACA design: 12 | Analytical design point, 1956 |
| Modern commercial turbofan | GE90-94B: 40; GE90-115B: 42 | Overall pressure ratio at max power, GE product page |
| Next-generation commercial | GE9X: 60 | GE product page; LEAP-1A: 40, LEAP-1B: 41 (MTU) |
| Aero-derivative industrial | SGT-A35: 22.0–24.5 | Siemens Energy configurations |
These values are design-point overall pressure ratios, typically at sea-level takeoff thrust. Direct comparison still requires matching rating conditions, ambient atmosphere, and pressure-station definitions.
Benchmarks show a clear climb from early turbojets (8–12:1) to modern high-bypass turbofans (40–60:1). Materials, aerodynamics, cooling, and stage-matching advances drove that jump.
Pressure Ratio Variation with Operating Conditions
Pressure ratio is not constant across the operating envelope. It varies with:
- Corrected spool speed — higher corrected speed raises pressure ratio along the compressor map
- Altitude — lower ambient pressure cuts absolute inlet and discharge pressures, while OPR still tracks corrected speed and mass flow
- Throttle position — NASA map examples move from low pressure ratio at part power to maximum ratio at full power
- Transient maneuvers — rapid throttle changes push the operating point toward surge (acceleration) or choke (deceleration)
No public source defines a universal idle-to-max pressure ratio sweep for current commercial turbofans. Compressor maps still show large movement in both pressure ratio and corrected mass flow as conditions change.
Safe Operating Boundaries and Margins
Compressor performance maps define two critical boundaries:
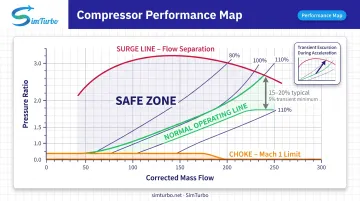
Surge/stall line (upper boundary): The surge line is the pressure ratio and mass flow combination where flow separation triggers catastrophic breakdown. NASA describes compressor stall as causing loss of engine power, large inlet and nacelle pressure transients, and possible flameout.
Running too close risks violent flow reversal, mechanical damage, and engine failure. Control systems hold surge margin—distance from the operating line to the surge line—typically 15–20% in steady running, and sometimes below 5% in transients.
Choke boundary (lower boundary): Choke occurs when flow at a controlling compressor section hits Mach 1, so mass flow cannot rise further regardless of pressure ratio. That limit caps acceleration rates and sets minimum corrected flow on each corrected speed line.
On a real-time compressor map (as in SimTurbo), the operating line sits against the surge line so margin is visible during maneuvers. One documented afterburner transient dropped surge margin from a normal 20–25% to below 5%, then adaptive fuel-flow and nozzle-area control restored operability.
Key Technical Properties of Pressure Ratio
Pressure ratio ties together compressor thermodynamic state points, aerodynamic performance, and mechanical energy input.
Property 1: Relationship to Compressor Work and Temperature Rise
Per NASA Glenn Research Center, specific compressor work equals the enthalpy change across the compressor: CW = cp × (Tt3 - Tt2), where cp is specific heat at constant pressure and Tt2, Tt3 are inlet and exit total temperatures.
For a given inlet temperature, raising pressure ratio increases both required shaft work and compressor discharge temperature:
CW = cp × Tt2 × [CPR^((γ-1)/γ) - 1] / η_c
where η_c is compressor efficiency. Higher pressure ratios demand more shaft power and produce higher discharge temperatures, which constrains rear-stage materials and may require active cooling. That trade-off limits achievable pressure ratio even when aerodynamic design would allow higher values.
Property 2: Coupling with Mass Flow and Efficiency
Pressure ratio, corrected mass flow, and adiabatic efficiency form the three-dimensional compressor performance map. These parameters are interdependent:
- Increasing pressure ratio at constant mass flow reduces efficiency and moves the operating point toward the surge line
- Design-point selection balances cycle efficiency gains against more stages, higher weight, and reduced surge margin
- Compressor maps plot corrected mass flow (x-axis) versus pressure ratio (y-axis) with efficiency contours and corrected-speed lines
SimTurbo's compressor/turbine matching interface displays these relationships interactively. Engineers can see how throttle changes, altitude, and control inputs shift the operating point relative to efficiency contours and stability boundaries.
How Pressure Ratio Is Calculated, Measured, and Validated
Pressure ratio serves as both a calculated design parameter during cycle analysis and a measured operational variable requiring precise instrumentation.
Calculation Methodology for Design and Simulation
Fundamental equation:
PR = P2c / P1c
where P2c and P1c are compressor discharge and inlet total (stagnation) pressures in absolute units (psia, kPa, or Pa).
Worked example: Calculate pressure ratio for a compressor with inlet conditions at 10,000 ft altitude (P1c = 10.1 psia) and discharge pressure of 350 psia.
PR = 350 psia / 10.1 psia = 34.7:1
Accounting for ram pressure rise: Flight speed increases inlet total pressure through isentropic ram compression:
P1c = P_ambient × [1 + ((γ-1)/2) × M²]^(γ/(γ-1))
where M is Mach number and γ ≈ 1.4 for air. This correction must be applied before calculating compressor pressure ratio to avoid incorrectly attributing inlet ram compression to the compressor itself.
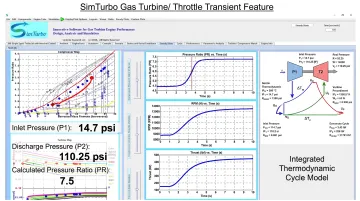
Those design equations become operational checks once a cycle model is running. Simulation approach: SimTurbo calculates pressure ratio in real time across transient maneuvers by integrating compressor performance maps with thermodynamic cycle models. The solver uses industry-standard gas-property tables, real-gas effects, compressor maps, and pressure-loss modeling.
When throttle, altitude, or Mach number changes, the simulation updates compressor inlet and discharge pressures, corrected mass flow, and operating-point position on the compressor map. Engineers can export transient data (pressure ratio, RPM, EGT, thrust, and fuel consumption) to Excel, MATLAB, or Python for post-processing and control-law validation.
Measurement and Verification Methods
Instrumentation: Total pressure probes, including rakes (parallel tubes aligned with flow) and five-hole probes (resolving flow angularity), measure total pressure at compressor inlet and discharge. NASA compressor tests have used 25-element grids across three measurement planes to capture spatial pressure distribution.
ICAO standards require mean total pressures, so spatial averaging and area weighting are essential for accurate overall pressure ratio.
Measurement challenges:
- Probe blockage if spatial density is excessive
- Temperature effects on pressure transducers and signal conditioning
- Spatial non-uniformity from wakes, tip leakage, and distortion requiring multi-point measurement
- Calibration drift, hysteresis, and reference-pressure errors
Accuracy considerations: No universal ±0.5% OPR requirement exists. NASA uncertainty budgets treat calibration, probe design, reference pressure, temperature, vibration, pressure lines, sampling, and curve fitting separately. Test-specific uncertainties must be propagated from individual channel measurements to overall pressure ratio.
Validation hierarchy:
- Steady-state test cell measurements provide highly accurate baseline data under controlled conditions
- In-flight measurements capture dynamic, real-world operation but are subject to disturbances and instrumentation challenges
- Simulation predictions depend on model fidelity, map accuracy, and thermodynamic assumptions
SimTurbo enables validation of pressure ratio predictions against test data so engineers can refine compressor component models. The platform's J85-GE-21 validation against NASA Lewis Research Center data achieved accuracy within ±2% for thrust, flow rate, temperature, and thrust-specific fuel consumption.

Implications of Operating Outside the Recommended Range
Operating at pressure ratios beyond safe boundaries hurts performance, shortens component life, and can create safety risks.
Compressor surge (excessive pressure ratio for the mass flow): Surge occurs when the compressor attempts to produce a pressure ratio beyond the aerodynamic capability of the airfoil stages at that corrected flow. Flow separation spreads quickly and can reverse flow.
Typical consequences include:
- Violent pressure oscillations
- Damage to blades, seals, and bearings
- Combustor flameout and unrecoverable engine failure
Control systems limit acceleration rates, modulate fuel flow, and adjust variable geometry to hold adequate surge margin.
Performance degradation (insufficient pressure ratio): Operating at pressure ratios below design values reduces thrust output, increases specific fuel consumption, and can leave the engine short of mission requirements. Low pressure ratio may result from component degradation, control system faults, or incorrect throttle scheduling, particularly at altitude or during transient maneuvers.
Material and life-reduction consequences: Excessive compressor discharge temperatures from high pressure ratios accelerate creep, oxidation, and thermal fatigue in downstream turbine components. Discharge temperature stresses compressor rear-stage materials directly. Turbine life still depends on combustor-exit gas temperature, blade metal temperature, cooling effectiveness, stress, and exposure history. High-pressure-ratio operation must stay within material limits across the hot section.
Common Misinterpretations of Pressure Ratio in Practice
Misreading pressure ratio definitions or calculation methods produces large analysis errors:
- OPR vs. stage pressure ratio: OPR covers the full compression system; stage ratios are typically only 1.2–1.5. Using OPR at stage level skews performance estimates and stage matching.
- Constant ratio across the envelope: Pressure ratio shifts with throttle, altitude, Mach number, and engine health. Design-point OPR does not represent idle, climb, cruise, or degraded conditions.
- Gauge vs. absolute pressure: At altitude, gauge-based ratios can err by 20–30% or more. Always use absolute total pressures.
- Pressure ratio vs. compression ratio: Compression ratio is a piston-engine volume ratio, not a gas-turbine parameter. The two measure different quantities and are not interchangeable.
Conclusion
Pressure ratio is the governing thermodynamic parameter for gas turbine compressor performance. It directly determines cycle efficiency, thrust capability, operability margins, and material life.
Accurate calculation requires absolute total pressures corrected for altitude and ram effects. Measurement demands multi-point instrumentation, spatial averaging, and careful uncertainty propagation.
Platforms like SimTurbo help engineers and students visualize pressure ratio behavior in real time across transient conditions—from startup and slam acceleration to afterburner events and compressor stall. Integrating compressor performance maps with thermodynamic cycle models validated against NASA test data supports both classroom learning and professional control system validation.
Frequently Asked Questions
What is the turbo pressure ratio?
Turbo pressure ratio is compressor discharge total pressure divided by inlet total pressure. It measures how much the compressor raises air pressure and is usually written as 40:1 or simply 40. It strongly drives gas turbine thermal efficiency and thrust.
What pressure ratio is typical for different types of gas turbine engines?
Examples range from early turbojets like the J85-21 at 8.30:1 to modern high-bypass turbofans such as the GE90 (40–42:1) and GE9X (60:1). Higher ratios raise efficiency but need more compressor stages, tougher materials, and tighter controls.
How do you calculate pressure ratio?
Use PR = P2c / P1c, with both pressures in absolute units (discharge over inlet total pressure). Example: 350 psia / 10.1 psia = 34.7:1. Include altitude and ram effects when you set inlet total pressure.
Why do higher pressure ratios improve engine efficiency?
In the Brayton cycle, thermal efficiency rises with pressure ratio: η = 1 - (1/PR^((γ-1)/γ)). You extract more work from the hot gas and reject less heat. The trade-off is higher compressor work, hotter discharge air, and more design complexity.
What happens if a compressor operates at too high a pressure ratio?
Too high a pressure ratio for the mass flow can trigger surge or stall. Flow separates, pressure swings hard, and reverse flow can start. That risks power loss, combustor flameout, and damage to blades, seals, and bearings.
How is pressure ratio measured and validated in gas turbine testing?
Inlet and discharge total-pressure rakes (or pitot probes) map the flow; values are area-averaged to get overall PR and checked against design models. SimTurbo’s J85-GE-21 model matched NASA test data within about ±2% on thrust, flow, temperature, and fuel burn.