Introduction
Designing centrifugal compressors that deliver high efficiency, optimal pressure ratios, and reliable operation across varying conditions remains one of the most complex challenges in turbomachinery engineering. Engineers must simultaneously optimize aerodynamic performance, mechanical integrity, surge margin, and map width, all while compressing development timelines and controlling costs.
Traditional physical prototyping imposes significant constraints. SwRI's configurable single-stage test rig, for example, uses a 200 hp drive, an 11:1 gearbox, and a spindle rated to 40,000 rpm, with NIST-traceable instruments for pressure, temperature, and flow angle.
Changing impellers, diffusers, seals, or volutes still means physical hardware swaps, which limits iteration speed and design-space exploration.
Simulation removes those bottlenecks with rapid virtual prototyping, detailed flow-field analysis, and multi-point optimization. Those capabilities complement physical testing and shorten time-to-market. This article examines how simulation supports centrifugal compressor development, from aerodynamic prediction to structural validation.
Key Takeaways
- NASA's HECC stage reached a 4.68 pressure ratio and 85.5% polytropic efficiency, above typical industrial ranges
- Validated CFD holds pressure-ratio error under 2%, yet stall-margin predictions can miss by 43%
- Genetic multipoint optimization gained 5.3% pressure ratio, 1.9% efficiency, 6.8% surge margin, and 1.4% choke flow
- Simulation flags surge, separation, shock losses, stress concentrations, and resonance before hardware tests
- ASME PTC 10 governs physical performance tests; simulation complements, not replaces, final validation
Understanding Centrifugal Compressors: Components and Operating Principles
Key Components and Flow Path
Centrifugal compressors convert kinetic energy into static pressure through four main stages:
- Inlet - Guides working gas axially toward the rotating impeller
- Impeller (rotor) - Accelerates gas radially outward using centrifugal forces, increasing velocity and pressure
- Diffuser - Converts high-velocity flow into static pressure through controlled deceleration
- Collector (volute) - Gathers pressurized gas and directs it to the discharge
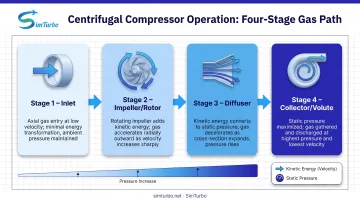
CFD studies show that splitter blades between main impeller blades reduce flow separation and improve uniformity at the diffuser inlet. The impeller imparts work to the gas in the rotating frame; the stationary diffuser then recovers kinetic energy as static pressure.
Operating Principles and Energy Transfer
Energy transfer follows turbomachinery work equations that link rotational speed, radius change, and velocity components. The impeller adds energy through mechanical work. The diffuser then applies compressible-flow principles to convert that velocity into pressure.
Pressure ratios depend heavily on the application:
- Single-stage aerospace designs often reach higher per-stage ratios than industrial units
- NASA's High Efficiency Centrifugal Compressor (HECC) achieved a measured 4.68 pressure ratio at 85.5% polytropic efficiency
- Industrial stages typically run lower ratios, tuned for efficiency and surge margin
Multiple stages multiply overall compression. A three-stage unit with 3.0 per-stage pressure ratio delivers a combined 27:1 ratio (3.0³).
Performance Characteristics Across Applications
Industrial applications prioritize efficiency and stability:
- Subsonic tip speeds minimize shock losses
- Efficiency targets of 88–92% are common
- Common service includes LNG, midstream, chemical/petrochemical, fertilizer, air separation, and oil and gas
- Atlas Copco offers centrifugal compressors reaching 205 bar and 560,000 m³/h
Aerospace designs trade some of that stability margin for power density:
- Transonic impeller speeds enable higher pressure ratios per stage
- NASA's HECC operated at a 0.81 work factor with 7.5% stall margin and 3 lbm/s corrected flow
- Compact packaging and weight constraints drive aggressive aerodynamic designs
Across both domains, map limits define usable operation:
- Surge - Global instability with possible flow reversal, distinct from localized rotating stall
- Choke - Maximum flow limit at high mass-flow rates
- Map width - Usable flow range between surge and choke; wider maps offer greater operational flexibility
- Off-design tradeoffs - Balancing peak efficiency against performance across the full speed line
Why Simulation is Critical in Centrifugal Compressor Design
Complexity of Multi-Point, Multi-Objective Design
Centrifugal compressor design requires simultaneous optimization of competing objectives:
- Pressure ratio at design point
- Peak efficiency and efficiency contour breadth
- Surge margin (distance from operating line to surge line)
- Choke margin (maximum stable flow capacity)
- Mechanical integrity (stress limits, fatigue life, resonance avoidance)
- Map width (operational flexibility across speed and flow ranges)
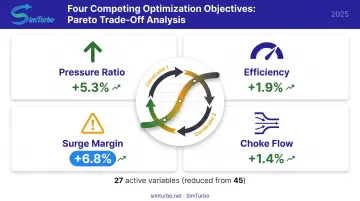
A peer-reviewed multipoint optimization using improved NSGA-II genetic algorithms showed severe nonlinear trade-offs among pressure ratio, efficiency, surge flow, and choke flow. No single design excelled on all four metrics at once. The study cut active design variables from 45 to 27 and improved design-point pressure ratio by 5.3%, efficiency by 1.9%, surge margin by 6.8%, and choke flow by 1.4%.
Compressors must also hold performance across varying speeds, inlet temperatures, and pressure conditions. System-level platforms like SimTurbo integrate compressor maps with turbine matching, thermodynamic cycle analysis, and control logic. That lets teams evaluate transient maneuvers, altitude changes, and off-design operation alongside detailed component-level CFD.
Limitations of Physical Prototyping
Physical testing remains essential for final validation, but it imposes constraints:
- Hardware dependency — Each impeller, diffuser, seal, IGV, or volute change needs new parts manufactured and installed
- Instrumentation limits — Surface sensors and probe traverses cover selected planes; secondary flows, separation zones, and shocks stay hard to observe
- Test-rig infrastructure — Facilities like SwRI’s single-stage rig (200 hp/150 kW drive, 11:1 gearbox, 40,000 rpm spindle, NIST-traceable calibration) are scarce and expensive to book
Each hardware loop therefore costs far more time and budget than a comparable simulation pass.
Flow Phenomena Requiring Detailed Analysis
Critical aerodynamic phenomena include:
- Turbulence and boundary layers — Model choice strongly affects separated flow, secondary vortices, and diffuser wakes, even when global metrics stay within 2%
- Flow separation — Off-design incidence cuts efficiency and can trigger instability
- Rotating stall — Localized circumferential disturbances that propagate and degrade the map
- Surge — System-level instability that can reverse flow through the compression system
- Secondary flows — Pressure-gradient and curvature-driven vortices that add loss
- Tip clearance losses — Blade-tip gap flow forms leakage vortices
- Running clearance — FSI predicts tip gap after thermal and centrifugal deformation
- Compressible flow effects — Transonic shocks demand careful blade shaping to limit loss
- Real-gas behavior — Refrigerants, hydrocarbons, and supercritical CO₂ need EOS property models, not ideal-gas assumptions
NASA tied HECC performance shortfalls to unsteady impeller-diffuser interaction, corrected-flow mismatch, incidence effects, and possible separation in the radial-to-axial bend. Mixing-plane steady RANS did not capture those mechanisms fully.
Time-to-Market and Competitive Advantages
Simulation accelerates design iteration by enabling:
- Rapid configuration testing - Evaluate multiple geometries in parallel
- Early problem identification - Detect surge risk, excessive stress, or resonance before hardware commitment
- Larger design-space exploration - Test unconventional blade shapes, diffuser geometries, or meridional contours without manufacturing cost
- Multi-point optimization - Simultaneously improve performance at design point, part-load, and near-surge conditions
One published near-surge CFD case needed 5.27 hours (SST) to 18.76 hours (omega Reynolds stress) per operating point, depending on model fidelity. Those cycles still finish in hours, not the weeks typical of prototype fabrication and rig testing.
Industry Validation and Standards
ASME V&V 20 quantifies CFD accuracy by comparing simulation predictions against experimental data for specific variables and validation points. Published centrifugal compressor validation studies report:
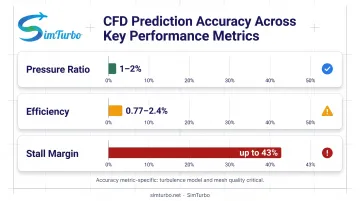
- Radiver study - Five turbulence models kept global total-to-total performance within approximately 2% of experiments; near-surge efficiency discrepancies ranged 0.77–2.18%
- 2019 RANS validation - Predicted pressure ratio within 1–2% and overall design-point performance within 1.2%, but underpredicted stall margin by 43%
- NASA HECC pretest CFD - Overpredicted efficiency by 2.4 percentage points and stall margin by 4.5 points
Accuracy is metric-specific. Pressure ratio and efficiency often land within 1–2% of test data, while surge-line and stall-margin predictions carry more uncertainty and hinge on turbulence model, mesh quality, and operating point.
ASME PTC 10 sets physical test procedures for delivered flow, pressure rise, power, efficiency, surge point, and choke point. It does not treat CFD as a substitute for acceptance testing. Simulation complements empirical validation; it does not replace it.
Key Simulation Capabilities and Analysis Types
Centrifugal compressor simulation spans aerodynamic performance, structural integrity, and multi-physics coupling. Engineers combine these analysis types to build maps, set clearances, and validate designs before hardware testing.
Computational Fluid Dynamics (CFD) for Aerodynamic Performance
Governing equations and turbulence modeling:
- Validated workflows solve compressible Reynolds-averaged Navier-Stokes (RANS) equations with ideal-gas or real-gas property models
- Turbulence models include Spalart-Allmaras, SST k-ω, curvature-corrected SST, SSG Reynolds stress, and omega Reynolds stress
- Model selection affects prediction of separated flow, secondary vortices, and diffuser wakes
Rotor-stator interaction methods:
- Mixing plane - Circumferentially averages rotating-domain exit fluxes for the stationary diffuser; reduces computational cost but loses unsteady jet-wake detail
- Frozen rotor - Retains impeller jet-wake structure at a fixed relative position; less expensive than fully unsteady methods
- Sliding mesh / time-accurate - Resolves unsteady impeller-diffuser interaction; required when mixing-plane steady RANS underpredicts observed phenomena
Performance map generation:
- CFD produces speed lines showing pressure ratio, efficiency, and mass flow across operating speeds
- Physics-based reduced-order methods have predicted turbocharger maps within ±2% for pressure ratio and efficiency, with higher uncertainty for surge limits
Structural and Mechanical Analysis
Finite element analysis (FEA) applications:
- Static stress - Centrifugal and thermal loads at operating speed and temperature
- Modal analysis - Natural frequencies and mode shapes
- Campbell diagrams - Resonance crossings from natural frequencies versus rotational speed, including gyroscopic effects
- Fatigue analysis - Cyclic stress margins across the operating envelope
Published centrifugal impeller studies combine static, modal, resonance, and fatigue analyses to ensure mechanical integrity across the operating envelope. Blade deflection analysis at high-speed operation informs running clearance requirements.
Integrated Multi-Physics Simulation
Conjugate heat transfer (CHT):
- Couples solid and fluid domains to predict temperature distribution in high-pressure-ratio stages
- Enables thermal-stress analysis and material selection for hot-section components
Fluid-structure interaction (FSI):
- Predicts impeller deformation under aerodynamic, centrifugal, and thermal loads
- Calculates hot running tip clearance after blade deflection
- Engineers then recalculate aerodynamic performance with the updated clearances
Real-gas property modeling:
- Required for refrigerants, hydrocarbons, supercritical CO₂, and other non-ideal gases
- A 2025 ASME study reported experimentally verified optimization of a two-stage real-gas centrifugal compressor using coupled pressure-based CFD
Performance Prediction and Optimization
Surge and choke prediction:
- Identifies low-flow instability (surge line) and high-flow capacity limits (choke)
- Surge-line prediction carries greater stage-to-stage uncertainty than pressure-ratio or efficiency-map prediction
Efficiency mapping:
- Contour plots show efficiency across speed and flow ranges
- Validates design-point guarantee and quantifies part-load performance
Parametric studies:
- Blade loading distribution, lean, sweep, and meridional shape
- Splitter-blade geometry to reduce separation and improve diffuser-entry flow
Specialized Capabilities for Modern Design Challenges
Machine learning and surrogate modeling help quantify design uncertainty. One robustness study combined 3D CFD, Monte Carlo analysis, self-organizing-map neural networks, and Kriging to explore variation in operating conditions and manufacturing tolerances.
For off-design work, system-level platforms like SimTurbo integrate compressor performance maps with turbine matching and thermodynamic cycle analysis. That setup predicts behavior across altitude, ambient temperature, and transient maneuvers.
Control integration is another active thread. Peer-reviewed studies have demonstrated model-predictive, torque-assisted anti-surge control for variable-speed centrifugal compressors.
Simulation Workflow: From Design to Validation
A clear CFD path takes centrifugal compressor geometry from first mesh to validated maps you can trust in design reviews. The sequence below is what most published compressor studies follow.
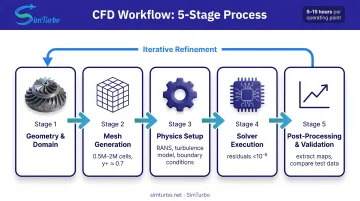
Typical CFD workflow for centrifugal compressor analysis:
- Geometry and domain - Define impeller, tip gap, diffuser, and collector; use periodic single-passage models when symmetry permits
- Mesh generation - Published studies use structured hexahedral grids (0.5M–2M cells) with target y⁺ ≈ 0.7 for near-wall resolution; boundary-layer refinement captures viscous effects
- Physics setup - Specify gas properties (ideal or real-gas EOS), rotating and stationary domains, and wall treatment. Set inlet total pressure/temperature, outlet mass flow or pressure, and the interface method (mixing plane, frozen rotor, or sliding mesh)
- Solver execution - Converge residuals (for example, below 10⁻⁶) and monitor mass-averaged performance metrics until stabilized
- Post-processing - Extract pressure ratio, efficiency, temperature rise, and velocity fields; assemble multiple operating points into speed lines
Validation methodology:
- Compare simulation against experimental data, test performance maps, or legacy designs
- Perform grid-sensitivity studies (0.5M, 1M, 2M cell comparisons)
- Use calibrated instrumentation and repeated test-rig speed lines as reference
- Quantify discrepancy by variable and operating point; report both global (pressure ratio, efficiency) and local (flow angles, wall static pressure) agreement
Iterative design refinement:
Simulation insights drive changes to blade angles, diffuser geometry, or meridional contours. Teams then re-mesh, re-analyze, and lock an optimized design before building physical prototypes.
System-level platforms like SimTurbo complement component CFD. They fold validated compressor maps together with turbine performance, combustor pressure drop, and control logic so engineers can check engine-level behavior and transient response before detailed component design.
Performance Analysis and Optimization Through Simulation
Complete performance maps in hours, not weeks:
- Simulation generates pressure ratio, efficiency, and power consumption across the full operating range
- Each operating point may require 5–19 hours depending on turbulence model and convergence criteria
- Parallel execution enables exploration of multiple configurations simultaneously
Multi-point optimization:
- Genetic algorithms or gradient-based methods improve surge margin, choke margin, peak efficiency, and design-point performance simultaneously
- Self-organizing maps reduce active design variables (for example, from 45 to 27) by identifying parameters with greatest influence
- Example result: pressure ratio +5.3%, efficiency +1.9%, surge margin +6.8%, choke flow +1.4%
Trade-off analysis:
- Aerodynamic performance versus mechanical constraints (stress limits, fatigue life, resonance avoidance)
- Manufacturing feasibility (casting tolerances, blade thickness, surface finish)
- Pareto-optimal configurations when nonlinear trade-offs prevent any single design from excelling on all metrics
Simulation reduces reliance on trial-and-error prototyping. Engineers can explore innovative geometries, such as unconventional diffuser vane angles or meridional shapes, without physical fabrication risk.
System-level tools like SimTurbo extend this further by showing how compressor-map changes affect gas turbine cycle performance, control stability, and transient behavior.
Frequently Asked Questions
How does a centrifugal compressor work?
Gas enters axially at the inlet, flows into the rotating impeller where centrifugal forces accelerate it radially outward, then exits the impeller at high velocity. The stationary diffuser converts kinetic energy into static pressure through controlled deceleration, and the collector gathers the pressurized gas for discharge.
What are the main advantages of using simulation for centrifugal compressor design?
Simulation enables rapid iteration without hardware builds, visualization of separation and shocks, early surge-risk detection, and broader design-space exploration. Validated CFD often reaches 1–2% accuracy on pressure ratio and efficiency, reducing physical testing without eliminating it.
What types of performance issues can simulation identify before physical testing?
Simulation detects surge and rotating stall precursors, flow separation and incidence mismatch, shock losses in transonic stages, excessive stress concentrations, resonance risks on Campbell diagrams, and tip-clearance losses. These issues are far costlier to discover in hardware.
How accurate is centrifugal compressor simulation compared to experimental data?
Accuracy is metric-specific. Validated models often keep pressure ratio and efficiency within 1–2%, while surge-line and stall-margin predictions can deviate more (43% in one published case). Mesh quality, turbulence model, and proximity to instability all affect results.
What are the key differences between steady-state and transient compressor simulations?
Steady-state (mixing-plane or frozen-rotor RANS) captures time-averaged performance for design-point analysis and map generation; transient (sliding-mesh, time-accurate) resolves unsteady impeller-diffuser interaction, surge inception, rotating stall development, and control system response. Transient simulations cost substantially more but provide insight into dynamic phenomena.
Can simulation replace physical testing entirely?
No. ASME PTC 10 still requires physical acceptance testing for flow, pressure rise, power, efficiency, surge, and choke. NASA CFD-to-test gaps (2.4 points efficiency, 4.5 points stall margin) show why simulation reduces prototype iterations but does not replace final hardware verification.
About SimTurbo
SimTurbo, a product of Controls Research LLC (Frankfort, Illinois), provides cloud-based gas turbine engine simulation, architecture design, and control system design software for aerospace, power systems, and academic users.
The platform pairs compressor and turbine performance maps with thermodynamic cycle analysis, transient modeling, and FADEC control logic so engineers can evaluate steady-state, off-design, and transient behavior. Its J85-GE-21 single-spool turbojet model was validated against NASA Lewis Research Center test data within ±2% for thrust, flow rate, temperature, and TSFC.
SimTurbo offers a 30-day free trial, monthly and annual subscriptions, lifetime licenses, and discounted educational programs. Learn more at simturbo.net or contact pjhoffman@simturbo.net / (779) 390-4786.