Key Takeaways
- Thermodynamic cycle analysis plus component models predicts power, efficiency, and fuel use across conditions
- Iterative matching balances compressor and turbine on shared shafts under mass and energy conservation
- Simulation tools support real-time what-if and off-design runs for temperature, altitude, and load
- Test-data validation can reach ±2% accuracy on thrust, flow, temperature, and TSFC
- Component maps capture efficiency shifts and limits such as surge margin
What Is Gas Turbine Performance Calculation?
Gas turbine performance calculation predicts the thermodynamic and mechanical behavior of an engine under different operating conditions. Engineers build those predictions from mathematical models and empirical data.
Common Applications:
- Design and development of new engines or configurations
- Operational planning and efficiency optimization
- Troubleshooting and diagnostics
- Control system development and validation before hardware testing
- Performance monitoring and condition-based maintenance
- Academic research and engineering education
Calculation Approaches
Engineers choose different methods based on available data and required accuracy:
Design-point calculations establish performance at rated conditions—typically ISO standard reference conditions (15°C / 59°F, sea level). These provide baseline metrics like rated power, efficiency, and pressure ratio.
Off-design performance analysis covers part-load operation, ambient temperature swings, altitude changes, and degraded components. It depends on component characteristic maps and iterative solution methods.
Transient analysis models dynamic events like startup, shutdown, rapid acceleration, and load changes. This supports control-system design and protection-logic validation.
Component-level versus system-level modeling asks whether you treat the engine as one black box or as linked compressors, combustors, turbines, and related elements. Component-based models show how each subsystem drives overall performance.
Why Gas Turbine Performance Calculation Is Critical in Engineering
Design Optimization and Cost Reduction
Performance calculations let engineers evaluate multiple design configurations virtually before building physical prototypes. By testing pressure ratios, turbine inlet temperatures, and component efficiencies in simulation, teams lock in stronger architectures sooner.
NASA notes that teams rely more on mathematical models because physical gas turbine development is costly and high-risk.
Fuel Consumption and Efficiency Prediction
Thermal efficiency directly sets fuel demand. For a fixed power output, fuel energy input equals P_net / (eta_th × LHV), where LHV is the fuel's lower heating value.
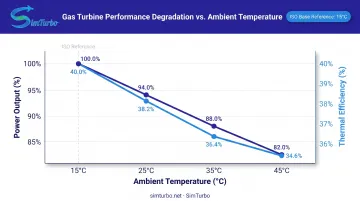
EIA data shows 2024 full-load averages of 7,548 Btu/kWh for natural-gas combined cycle and 10,999 Btu/kWh for simple-cycle gas turbines. Small efficiency gains cut fuel use in a measurable way. Ambient conditions matter as well: peer-reviewed studies report that each 1°C rise in ambient temperature reduces power by about 0.6% and thermal performance by 0.18%.
Control Strategy Validation
Gas turbines operate within strict temperature, pressure, and speed limits. Performance models validate control logic by simulating the engine's response to throttle commands, ambient changes, and fault conditions. Engineers test fuel scheduling, variable geometry, and protection functions across the operating envelope before implementing full-authority digital engine control (FADEC) systems. That early validation lowers implementation risk and shortens certification timelines.
Condition Monitoring and Diagnostics
Baseline performance expectations allow operators to detect deviations caused by fouling, erosion, or component degradation. NASA's approach compares measured snapshots with a nominal reference model to isolate faults and trend performance over time. Real-time diagnostics can trigger maintenance before failures occur, which raises availability and lowers lifecycle cost.
Educational Foundation
Universities use performance calculations to teach thermodynamic principles, component matching, and system integration. Students map compression, combustion, and expansion on T-S and P-V diagrams and see how design choices change efficiency, thrust, and fuel burn. Simulation-based labs prepare graduates for turbomachinery and propulsion roles.
How Gas Turbine Performance Calculation Works – Step by Step
Gas turbine performance calculation follows a systematic process from defining operating conditions through interpreting results. Each step builds on the previous. Engineers can choose methods from simplified Brayton cycle analysis to detailed component-level modeling, with clear trade-offs between accuracy and complexity.
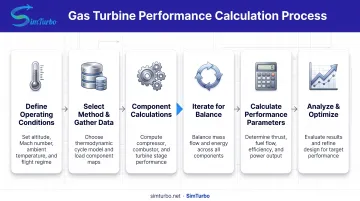
Step 1 – Define Operating Conditions and Requirements
Establish boundary conditions and constraints:
- Ambient conditions: Temperature, pressure, and humidity at the inlet
- Required output: Power level, shaft speed, or thrust target
- Fuel properties: Type (natural gas, jet fuel, or liquid fuels) and lower heating value
- Operational constraints: Maximum turbine inlet temperature, minimum surge margin, altitude, and flight Mach number
This step determines which calculation approach is appropriate and what input data you'll need.
Step 2 – Select Calculation Method and Gather Input Data
Choose your modeling fidelity:
- Thermodynamic cycle analysis (Brayton cycle): Quick estimates assuming ideal component behavior
- Component characteristic maps: Captures real compressor and turbine performance including off-design behavior and efficiency variations
- Empirical correlations: Uses regression models trained on test data
- Detailed CFD/FEA approaches: High-fidelity aerodynamic and structural analysis for complex geometries
Gather the inputs your method requires:
- Compressor maps (pressure ratio vs. corrected flow and efficiency)
- Turbine maps and combustor efficiency
- Mechanical losses and bleed-air extractions
- Validation test data, when available
Platforms such as SimTurbo let you run cycle analysis and component-map matching in one model so you can change fidelity without rebuilding the solver.
Step 3 – Perform Component-Level Calculations
Calculate each component's contribution:
Compressor: Determine pressure ratio, temperature rise, and efficiency based on corrected speed and mass flow. Find actual outlet enthalpy from isentropic efficiency: h_out = h_in + (h_out_isentropic - h_in) / eta_compressor.
Combustor: Apply energy balance to find outlet conditions: h_out = (W_in × h_in + W_fuel × LHV × eta_combustor) / W_out. Account for pressure loss: Pt_out = (1 - dP) × Pt_in.
Turbine: Calculate expansion ratio, temperature drop, and power output. Actual enthalpy drop equals isentropic enthalpy drop times turbine efficiency. Power equals mass flow times the enthalpy change.
Step 4 – Iterate to Achieve Thermodynamic Balance
Gas turbine calculations require iterative solutions because compressor and turbine are mechanically coupled on the same shaft. Adjust variables until:
- Power balance: Turbine power equals compressor power plus useful output plus mechanical losses
- Mass balance: Flow continuity is satisfied through all components
- Shaft torque balance: Sum of torques equals zero at steady state
NASA's documented approach uses a secant solver to match component maps and close these residuals simultaneously.
Step 5 – Calculate Overall Performance Parameters
Compute key metrics:
- Thermal efficiency: Net power output divided by fuel energy input
- Specific fuel consumption: Fuel flow rate per unit power (kg/kWh or lb/hp/hr)
- Power output or thrust: Net mechanical or propulsive work
- Exhaust temperature: Temperature leaving the turbine or nozzle
- Pressure ratio: Overall compressor pressure rise
Validate results against known benchmarks or test data. Identify any violations of operating limits such as maximum turbine inlet temperature or minimum compressor surge margin.
Step 6 – Analyze Results and Optimize
With validated numbers in hand, run sensitivity checks on ambient conditions, component efficiencies, and control settings. Use those insights to:
- Refine component design (blade geometry, cooling schemes)
- Optimize control algorithms (fuel scheduling, variable geometry logic)
- Plan operational strategies (load dispatch, maintenance intervals)
- Support regulatory certification and contractual performance guarantees
Key Gas Turbine Performance Calculation Methods and Formulas
Brayton Cycle and Component Map Methods
The ideal Brayton cycle provides quick performance estimates using closed-form relationships. For a perfect gas with constant specific heats and reversible adiabatic processes:
- Temperature ratio:
TR = T2/T1 = PR^((gamma-1)/gamma) - Ideal thermal efficiency:
eta_Brayton = 1 - 1/TR = 1 - 1/PR^((gamma-1)/gamma)
This method suits screening studies and teaching fundamentals. It assumes idealized component behavior and does not capture real-world losses, variable efficiencies, or off-design operation.
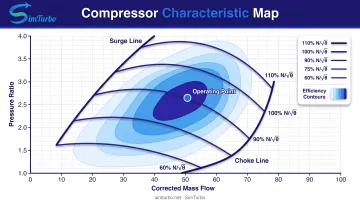
Compressor and turbine maps relate pressure ratio, corrected speed, corrected mass flow, and efficiency. These maps capture real component behavior, including:
- Efficiency variations across the operating range
- Flow capacity at different speed lines
- Surge and choke limits
- Off-design performance
Corrected parameters normalize for ambient conditions:
W_corrected = W × sqrt(theta) / delta
where theta and delta are temperature and pressure ratios relative to reference conditions. Maps must be scaled to match known design-point data, then interpolated during off-design calculations.
Energy Balance, Mass Continuity, and Ambient Corrections
Conservation principles govern all gas turbine performance calculations:
Mass continuity: Steady flow through each component equals inlet flow plus or minus fuel, bleed, or cooling extraction. For the combustor: W_out = W_in + W_fuel.
Energy balance in combustor: h_out = (W_in × h_in + W_fuel × LHV × eta_combustor) / W_out, where LHV is fuel lower heating value.
Shaft power balance: At steady state, turbine power equals compressor power plus useful output plus mechanical losses. During transients, add rotor inertia and acceleration terms.
Performance also varies with temperature, pressure, and humidity. NASA defines corrected weight flow as W × sqrt(theta) / delta, though specific reference values must be documented.
ISO 3977-2:2023 specifies standard reference conditions and ISO ratings for gas turbines. ASME PTC 22-2023 covers test boundaries and normalization for reported parameters, including corrected power, heat rate, exhaust flow, and exhaust temperature.
Key principle: Compare results only after applying a documented reference convention. Uncorrected comparisons at different ambient conditions are meaningless.
Advanced Calculation Approaches
When map-based steady-state models are not enough, engineers move to higher-fidelity methods:
- Stage-stacking: Models compressors and turbines stage-by-stage for detailed aerodynamics and inter-stage matching. Requires extensive geometric and aerodynamic input data.
- Cooled turbine models: Account for blade cooling extraction, film cooling, and mixing with the main gas path. Cooling reduces effective turbine efficiency and changes exhaust temperature.
- Transient models: Add rotor inertia, heat-soak effects, and time-dependent control responses. Support start-up analysis, slam-acceleration studies, and FADEC development.
Gas Turbine Performance Calculation – Example Case Walkthrough
Scenario
An industrial gas turbine is at full load under ISO conditions (15°C, sea level). Establish design-point performance, then predict off-design behavior when ambient temperature rises to 35°C.
Step-by-Step Calculation
1. Start with design-point data:
- Pressure ratio: 21:1
- Turbine inlet temperature: 1,300°C
- Mass flow: 180 kg/s
- Design power output: 50 MW
- Design thermal efficiency: 40%
2. Evaluate performance at elevated temperature (35°C):
Air density falls as ambient temperature rises, so compressor mass flow drops. Read the new compressor operating point from the component maps:
- Corrected mass flow decreases because
W_corrected = W × sqrt(theta) / delta - Compressor pressure ratio drops slightly as the operating line moves left on the map
- Compressor efficiency may degrade slightly off-design
3. Apply energy balance in combustor:
To hold turbine inlet temperature constant, fuel flow must rise to offset hotter compressor discharge air. The combustor energy balance sets the required fuel addition.
4. Calculate turbine performance:
With a lower expansion ratio (from the reduced compressor pressure ratio) and the same turbine inlet temperature, the turbine delivers less specific work. Turbine efficiency also shifts with corrected speed and flow.
5. Compute overall performance:
Power falls with ambient temperature—about 0.6% per °C is a common industry rule of thumb. For this machine, a 20°C rise implies roughly 12% less output, or about 44 MW versus the 50 MW design point. Thermal efficiency eases by on the order of 0.18% per °C, and exhaust temperature climbs because less energy is extracted at the same firing temperature.
Common Mistakes and Practical Insights
Mistakes to Avoid:
- Skipping mass-flow and speed corrections for ambient conditions before reading component maps
- Ignoring compressor-turbine matching on the shared shaft; both machines must balance
- Treating component efficiencies as fixed when maps show they change across the operating range
- Comparing ambient cases without normalizing to a common reference
Practical Insights:
- Use 0.5–0.7% power loss per °C when screening site ambient limits and contractual guarantees
- Budget for lower compressor pressure ratio and higher exhaust temperature at constant firing temperature
- Fold off-design efficiency loss into heat-rate predictions, not power alone
- Expect the control system to trim fuel flow and variable geometry to stay inside limits
- Hand map-matching is slow for many ambient cases; tools such as SimTurbo run design-point and off-design matching so you can test temperature swings quickly
How SimTurbo Can Help
SimTurbo is a Windows-based simulation platform for engineers and students running gas turbine performance calculations. Its component-based architecture avoids black-box models, so you can see how each element—inlet, compressor, combustor, turbine, nozzle, shaft, recuperator, and afterburner—drives system results.
Key Capabilities
Real-time performance simulation
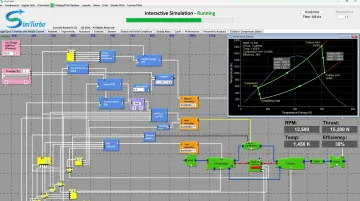
SimTurbo runs on standard PCs and updates interactive Temperature-Entropy (T-S) and Pressure-Volume (P-V) diagrams, operating points, and system behavior live. You can watch throttle changes, afterburner engagement, and startup sequences while tracking RPM, turbine inlet temperature, thrust, fuel consumption, and surge margin.
Component-based drag-and-drop architecture
Build simple-cycle, recuperated, intercooled, reheated, and afterburning configurations by connecting modifiable components on an open design palette. Add a recuperator, intercooler, or afterburner and immediately see the impact on the thermodynamic cycle, compressor-turbine matching, and mass-flow balance.
Validated calculation algorithms
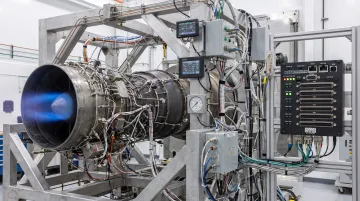
SimTurbo's J85-GE-21 single-spool turbojet simulation matched NASA Lewis Research Center test data within ±2% for thrust, flow rate, temperature, and thrust-specific fuel consumption (TSFC)—a practical baseline for design, teaching, and research.
Data export for post-processing
Export transient data—RPM, exhaust gas temperature, thrust, and SFC—to CSV or Excel. Use MATLAB/Simulink or Python for custom performance studies and control-law validation.
Educational focus with university support
Academic options include:
- Discounted student licenses and campus-wide deployments
- Custom class and laboratory programs
- Research and faculty licensing
- 30-day free trial, tutorials, and a 7:33 fundamentals video
These resources help students connect thermodynamic theory to real turbomachinery behavior. Contact (779) 390-4786 or info@simturbo.net for academic pricing.
Conclusion
Gas turbine performance calculation ties thermodynamics to component models and iterative solvers so you can predict system behavior and spot where efficiency is left on the table. Higher firing temperatures, flexible fuels, and hybrid-electric architectures only raise the bar: accurate calculation and simulation now drive design choices and day-to-day operating decisions.
Engineers who apply these methods can weigh trade-offs faster in aerospace propulsion, marine drives, and power generation. Tools such as SimTurbo support that work with component-based steady-state and transient studies, compressor–turbine matching, and control validation before hardware is locked in.
Frequently Asked Questions
How do you calculate gas turbine efficiency?
Thermal efficiency equals the ratio of useful power output to fuel energy input: eta_th = P_net / (W_fuel × LHV), where LHV is fuel lower heating value. Simple-cycle gas turbines typically achieve 35–42% efficiency, while combined-cycle systems exceed 60% by recovering exhaust heat for steam generation.
What is the formula for calculating gas turbine power?
Net power is turbine power minus compressor power and mechanical losses: P_net = eta_mechanical × [W × C_p × (T_turbine_in - T_turbine_out) - W × C_p × (T_compressor_out - T_compressor_in)], where W is mass flow and C_p is specific heat at the component inlet and outlet temperatures.
How do you calculate the critical speed of a gas turbine?
Critical speed comes from rotor dynamics analysis based on shaft dimensions and bearing configuration. The simplified formula is N_critical = (30/π) × sqrt(k/m), where k is shaft stiffness and m is rotor mass. Operating speeds are designed to avoid critical-speed resonance regions where vibration amplitudes spike.
What are the key performance parameters in gas turbine calculations?
Primary parameters include power output (MW or kW), thermal efficiency (%), specific fuel consumption (kg/kWh or lb/hp/hr), overall pressure ratio, turbine inlet temperature (°C), exhaust temperature (°C), mass flow rate (kg/s), and compressor surge margin (%).
What software tools are used for gas turbine performance analysis?
Engineers use specialized tools like SimTurbo for component-based modeling and real-time simulation, plus thermal platforms such as THERMOFLEX or GT PRO. Custom MATLAB/Simulink models, CFD for aerodynamics, and validation frameworks that compare results to test data are also common.
How accurate are gas turbine performance calculations compared to actual operation?
Well-validated models typically achieve 1–3% accuracy for power and efficiency at design conditions. A 2020 study on heavy-duty turbines reported average errors below 2.0% and maximum errors below 4.3%. Off-design accuracy depends on component-data quality, modeling fidelity, and how closely hardware matches design specs.