Many engineers struggle with a specific problem: they have data, but no structured way to translate readings into decisions. A 2018 peer-reviewed study of 14 reciprocating compressors used in CO2 transport found that continuous pressure monitoring had a "strong impact" on fleet productivity over a three-year period, though it stopped short of quantifying downtime reduction in hard percentages (Emerald Publishing, 2018).
This article walks through what compressor performance analysis actually involves, why it matters for your bottom line, and how simulation tools like SimTurbo let you validate compressor behavior before committing to hardware.
TL;DR
- Measures efficiency, pressure ratio, surge margin, and power under real conditions
- Weak analysis drives surge events, energy waste, and unplanned turbine failures
- Six steps: set objectives, gather data, prepare it, model, interpret, act
- SimTurbo lets engineers validate compressor behavior before physical testing
What Is Compressor Performance Analysis?
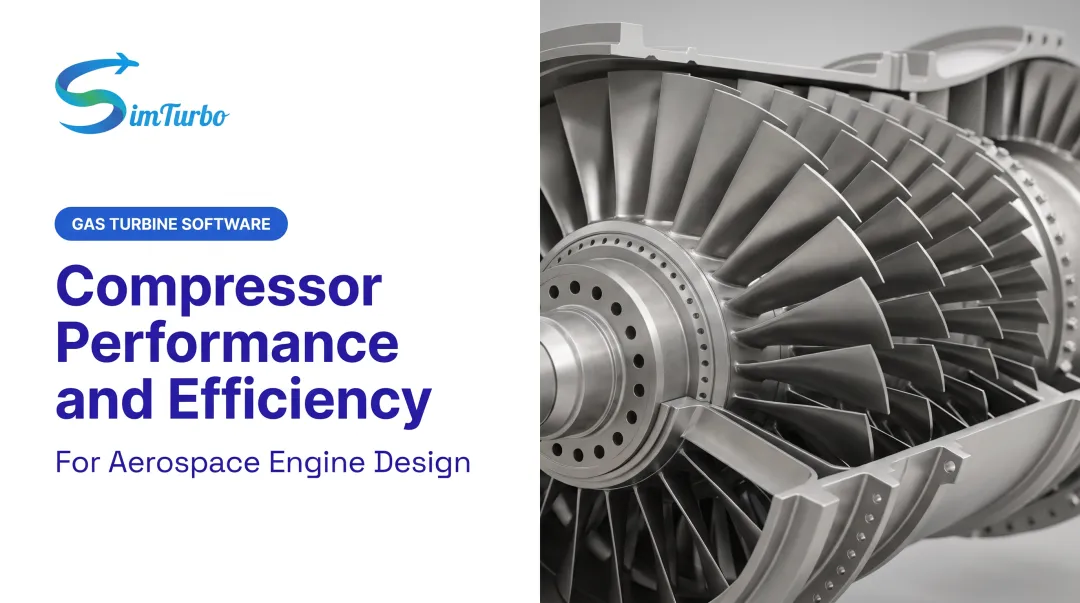
Compressor performance analysis is the systematic evaluation of a compressor's efficiency, pressure ratio, capacity, and stability across its operating envelope. Engineers apply it as an ongoing discipline across:
- Aerospace propulsion: validating turbojet and turbofan compressor stages
- Oil & gas: monitoring reciprocating and centrifugal units in field operations
- HVAC and industrial systems: tracking energy consumption and output
- Power generation: matching compressor behavior to turbine performance
- R&D and education: teaching thermodynamic cycle behavior hands-on
Two Analytical Paths
Engineers typically choose between rigorous thermodynamic methods (equation-of-state calculations, isentropic and polytropic efficiency) and shortcut or empirical methods that trade precision for speed.
Software-based simulation now often supplements or replaces early-stage physical testing. That lets teams explore more operating conditions without burning test-cell hours.
Why Compressor Performance Analysis Is Critical
Every compressor decision carries operational risk and lifecycle cost. Skip the analysis, and inefficiencies get baked into hardware you can't easily change later.
Here's what accurate analysis actually delivers:
- Better design decisions: inefficiencies surface before hardware commitment, not after
- Lower surge and stall risk: problems get flagged before they become failures
- Real energy savings: in compressed-air systems, only 10–20% of electric input reaches end use; 80–93% is lost as heat (BPA, 2006)
- Reduced leakage losses: undetected leaks can waste 20–30% of compressor output; detection and repair can cut that below 10%
- Predictive maintenance support: trend monitoring catches degradation before it becomes downtime
- Engineering credibility: data-backed decisions hold up under design and regulatory review

That energy waste isn't hypothetical. Without analysis up front, the same losses get locked into hardware and operating practice for the life of the system.
How Compressor Performance Analysis Works, Step by Step
These six stages turn raw compressor data into decisions you can act on. The most common failure is skipping validation against real operating maps—or ignoring off-design conditions entirely.
Step 1 – Define the Objective
Are you validating a new design, troubleshooting a fault, running an efficiency audit, or conducting research? Each goal changes your scope and the data you need. Skipping this step causes wasted effort chasing the wrong metrics.
Step 2 – Gather Inputs
Collect the essentials:
- Suction and discharge pressures
- Suction and discharge temperatures
- Flow rate
- Gas composition
- Rotational speed (RPM)
Incomplete inputs make later calculations look precise while staying wrong.
Step 3 – Organize & Prepare Data
Normalize everything to standard or reference conditions. Check for sensor drift or measurement errors before you trust a single number. Bad inputs produce confident-looking, wrong outputs.
Step 4 – Apply the Analysis Method
This is where the thermodynamics earn their keep. NASA defines compressor pressure ratio as CPR = pt3/pt2, and specific work as:
CW = ht3 − ht2 = cp × (Tt3 − Tt2)
With efficiency included, specific work becomes:
CW = cp × Tt2 × [CPR^((γ−1)/γ) − 1] / ηc
Here ηc is the compressor efficiency factor (NASA Glenn Research Center). Real efficiency is always below the ideal value of 1.0. Hand calc or simulation software, this step is where head, work, and efficiency numbers become usable.
Step 5 – Interpret Results
Compare calculated head, efficiency, and surge margin against OEM performance curves. A single number means little in isolation; the comparison against expected behavior is what builds decision confidence.
Step 6 – Act & Review
Turn the comparison into a concrete change:
- Adjust operating setpoints to recover efficiency or surge margin
- Schedule maintenance when drift from the map points to degradation
- Revise the design before freeze if off-design results miss targets
Then re-check the same metrics after the change so the next run starts from a known baseline.

Example Case Walkthrough: Tracing a Discharge Pressure Deviation
A simplified scenario used across industries shows how discharge-pressure analysis works in practice.
- Symptom: A compressor shows unexplained discharge pressure deviation. Goal: find the root cause.
- Gather evidence: Collect suction and discharge pressure, temperature, and flow across a defined test window—not one snapshot.
- Run the analysis: Compare actual isentropic and polytropic efficiency to expected values at multiple operating points, by calculation or simulation.
- Avoid the common mistake: A single reading can look normal while off-design points are already drifting. Use a range of conditions, not one operating point.
- Resolve it: Trace the deviation across the full operating range. Causes often include blade fouling, a shift in gas composition, or seal wear. You can then measure the fix as a specific efficiency gain, not a guess.
With a tool like SimTurbo, engineers can model that path across the map first—so the root cause shows up before a physical anomaly does.
How SimTurbo Can Help
SimTurbo, built by Controls Research LLC, is a component-based gas turbine simulation platform that lets you model compressor performance under real-time transient and steady-state conditions, without treating the engine as a black box.
Capabilities for Compressor Analysis
- Real-time, component-based simulation of inlets, compressors, combustors, turbines, and shafts, with each piece visible and adjustable
- Validated accuracy against NASA J85-GE-21 turbojet test data, with thrust, flow rate, temperature, and TSFC predictions reported within ±2%
- Data export to CSV and Excel for transient time-series values like RPM, EGT, thrust, and SFC
- Control-law validation through configurable PID controllers (Speed, Temperature, and Surge Margin PID), limiters, and FADEC logic
- University-friendly licensing for classrooms, labs, and research programs
In practice, SimTurbo's compressor demonstrations show surge margin sitting around 20–25% during normal operation, dropping below 5% during an afterburner transient. Adaptive control logic then modulates fuel flow and nozzle area to restore that margin, the kind of case Step 4 and Step 5 above are meant to catch.
You can overlay a compressor's operating line against its surge line in the platform, watch corrected mass flow and pressure ratio shift under changing conditions, and export the results for analysis in Excel or other tools.

For control-law work, SimTurbo exports built-in PID and FADEC responses as "plant" behavior so you can test your logic against a realistic engine model before it reaches a test cell.
Conclusion
Compressor performance analysis gives engineers clearer decisions and tighter control—whether the goal is catching a fault, validating a design, or cutting energy waste. The work is ongoing. It depends on accurate data, disciplined methods, and simulation tools that let you test ideas before you commit to hardware.
SimTurbo was built for that workflow: a component-level view of compressor behavior instead of a black box.
Frequently Asked Questions
What are three types of compressors?
Three common types are axial, centrifugal, and positive-displacement (reciprocating or rotary screw). Axial and centrifugal units dominate jet engines and industrial plants; positive-displacement machines are typical in refrigeration and smaller systems.
What is the formula for calculating compressor work?
NASA's specific-work relation is CW = ht3 - ht2 = cp × (Tt3 - Tt2), work per unit mass of airflow. Multiply by mass flow rate to get power: P = ṁ × (ht3 - ht2). Actual results always fall short of the ideal isentropic value due to real-world efficiency losses.
How often should compressor performance be tested or monitored?
Critical systems, such as aerospace propulsion or continuous power generation, warrant continuous monitoring. Smaller or less critical industrial units can rely on periodic audits, often quarterly or annually, depending on duty cycle and failure risk.
What causes compressor surge and how is it detected in performance analysis?
Surge occurs when flow reverses from poor aerodynamic stability, often after degradation or inlet distortion. Analysts plot corrected flow and pressure ratio against a surge-line map; NASA work shows margins can improve by up to 15% with changes such as diffuser air injection (NASA Glenn Research Center).
What's the difference between isentropic and polytropic efficiency?
Isentropic efficiency compares actual enthalpy rise to an ideal, reversible adiabatic process. Polytropic efficiency reflects real-world, multi-stage compression more accurately and is the accepted basis for ASME PTC-10 field-performance testing.
Can simulation software replace physical compressor testing?
No. Validated simulation speeds design iteration and lowers test cost, but it complements physical and field testing—especially for certification and edge-case validation—rather than replacing it.