Introduction
Gas turbine compressors consume approximately 50% of the turbine's power output, making compression the single largest energy demand in the engine cycle. For aerospace, marine, and power generation engineers, even small compressor inefficiencies cascade through the entire system.
They cut net thrust, raise fuel burn, and limit operational flexibility. Mastering compressor performance metrics is how teams optimize cycle efficiency and meet regulatory standards.
Engineers who master compressor analysis can predict behavior across operating conditions, identify efficiency losses before they reach test stands, and validate control strategies that prevent surge while maintaining maximum performance. This article breaks down the key metrics, thermodynamic fundamentals, loss mechanisms, and simulation tools that enable effective compressor optimization.
Key Takeaways
- A 1% compressor-efficiency gain yields ~0.5% cycle-efficiency improvement (MIT research)
- Track performance via pressure ratio, corrected mass flow, temperature rise, and isentropic/polytropic efficiency
- Blade friction, tip leakage (up to one-third of axial-stage losses), and shock interactions dominate losses
- Component-based simulation predicts performance in real time and validates controls before hardware testing
Understanding Compressor Performance Metrics
Pressure ratio (PR) is the fundamental parameter defining compressor work. It is the ratio of discharge total pressure to inlet total pressure:
PR = Pt,exit / Pt,inlet
PR sets the thermodynamic work required per stage and the number of stages needed to hit target cycle pressures. Practical engine ranges span a wide band:
- J85: PR 7
- CFM56-5B/-7B: PR 25.2
- GE90-class advanced turbofans: PR 40–42
Temperature ratio relates directly to pressure ratio through the isentropic exponent:
Texit / Tinlet = (Pexit / Pinlet)(γ-1)/γ
This relationship applies to ideal isentropic compression and establishes the theoretical minimum temperature rise. Real compression always exceeds this value due to irreversibilities.
Pressure and temperature ratios alone do not fully describe operability across flight conditions. Engineers also normalize mass flow so maps stay comparable when inlet conditions change.
Corrected Flow Parameters
NASA defines corrected flow per unit area as a function of Mach number, which removes inlet temperature and pressure variation from the comparison. Corrected weight flow is:
Wc = (ṁ × √θ) / δ
where θ and δ are temperature and pressure ratios to reference conditions. This allows one compressor map to represent behavior across altitudes, speeds, and ambient conditions.
Isentropic Efficiency
Isentropic efficiency compares actual compression work to the ideal reversible, adiabatic case:
ηisen = (hexit,ideal - hinlet) / (hexit,actual - hinlet)
Measured values vary by component and operating point. NASA reported 84.9% rotor efficiency and 83.1% stage efficiency for a transonic axial stage. A modern centrifugal research stage reached 85.5% polytropic efficiency.
Universal ranges should be treated carefully. Efficiency depends heavily on stage type, Reynolds number, and proximity to the design point.
Compressor Maps
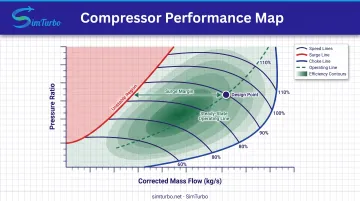
Maps plot pressure ratio and efficiency against corrected mass flow and corrected speed. The low-flow boundary is the surge line: the stability limit where flow reversal occurs. The high-flow boundary is the choke line, where sonic conditions stop further mass-flow increase.
Operating lines connect steady-state points and must stay safely between those limits. NASA modeling shows generic map scaling matches well near design speed but diverges in PR and flow at off-design conditions. Engine-specific maps remain the reliable basis for matching and control work.
Thermodynamic Efficiency Fundamentals
Isentropic Efficiency
Isentropic efficiency compares ideal enthalpy rise to the actual enthalpy rise across the compressor:
η_isen = (h_exit,ideal − h_inlet) / (h_exit,actual − h_inlet)
The ratio is the fraction of ideal work the real machine captures. In practice the denominator is always larger—the gap is work lost to friction, mixing, leakage, and other irreversibilities.
For constant specific heat, compressor work simplifies to:
CW = c_p × T_t,inlet × [PR^((γ−1)/γ) − 1] / η_c
Polytropic Efficiency
Polytropic efficiency tracks stage-by-stage performance. Engineers prefer it for multistage work because it stays independent of overall pressure ratio, so incremental losses stay visible as PR grows.
Reference points help set expectations: MIT’s cycle model used a 92% baseline polytropic efficiency in parametric studies, while NASA measured 85.5% in a centrifugal stage. That independence also makes fairer comparisons across compressor architectures.
Entropy Generation
Efficiency shortfalls show up as irreversible entropy. Those losses are what the isentropic and polytropic metrics are really scoring.
For small stage pressure rises, MIT gives:
η ≈ 1 − (T_t2 × Δs) / Δh_t
Stage-efficiency loss is dissipation from wall shear, wake mixing, and tip-leakage mixing, divided by stage work. More entropy generation means more energy ends up as unrecoverable heat instead of useful pressure rise.
System Impact
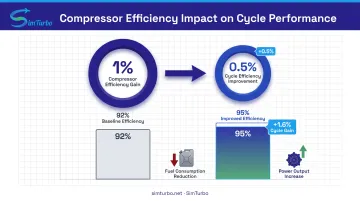
Those stage-level gains compound at engine level. MIT’s axial-stage study found that a 1% compressor-efficiency increase raises modeled cycle thermal efficiency by about 0.5%. Moving from a 92% baseline toward 95% produced a 1.6% cycle-efficiency gain.
In gas turbine design and cycle analysis, that sensitivity is why compressor maps, matching, and loss models get so much attention: small η_c changes show up as real fuel burn and power deltas.
Factors Affecting Compressor Efficiency
Aerodynamic Losses
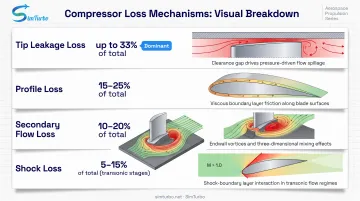
Tip leakage contributes up to one-third of total loss in axial compressors, according to a 2024 ASME review. Dominant mechanisms include within-gap separation and mixing, leakage-jet interaction with main flow, and endwall shear. In the analyzed configuration, within-gap loss accounted for 5-10% of passage loss, and leakage reached up to 30% of inlet dynamic head near peak suction.
Other major aerodynamic loss sources include:
- Profile losses — boundary-layer friction on blade surfaces
- Secondary flow losses — tip leakage and endwall effects that form three-dimensional structures, cutting pressure rise and raising entropy
- Shock losses — in transonic stages (relative Mach > 1.0), where shock/boundary-layer interaction can trigger separation
Loss distribution is case-specific, not universal. Low Reynolds numbers thicken boundary layers, while strong inlet swirl increases incidence and efficiency loss. Shock-dominated regimes require regime-specific analysis rather than generic percentage splits.
Design and Geometric Factors
MIT identified key efficiency variables:
- Stage loading and flow coefficient
- Reynolds number
- Aspect ratio and hub-tip ratio
- Tip-gap-to-height ratio
- Inlet swirl and solidity
In MIT's representative high-pressure compressor model, peak efficiency occurred at flow coefficient 0.4–0.6 and loading coefficient 0.2–0.3. Those are model results, not universal optima—but they show how sensitive efficiency is to aerodynamic loading.
Tip clearance has measurable impact: NASA experiments found that increasing clearance from 1.4% to 2.8% of blade height caused a 1.5-point efficiency penalty and 10% reduction in peak pressure ratio. Tighter clearances improve efficiency but complicate manufacturing and increase risk of rubs during transients.
Optimal geometry depends on the application. Deviations from design intent compound across stages when operating points fall out of match.
Operating Conditions
Reynolds Number Effects
Reynolds number governs boundary-layer behavior and transition. NASA centrifugal testing showed that reducing Reynolds number from 3.03M to 0.88M lowered peak efficiency from 81.3% to 80.0%; at 0.34M, efficiency fell to 77.5%. Maximum PR dropped from 1.96 to 1.90, and surge, maximum-flow, and best-efficiency points all shifted to lower flow rates.
Inlet Distortion
A 2023 axial-compressor study found that high co-rotating swirl reduced efficiency 6.7%, while high counter-rotating swirl cut it 7.8% and reduced stall margin. Low-intensity swirl had little effect—inlet quality hurts most under severe distortion.
Off-Design Operation
Compressors are designed for a specific operating point, usually cruise or base load. Moving away from design speed, altitude, or ambient conditions shifts the operating line on the compressor map. NASA modeling found that generic map matching worked well near design speed but PR and airflow diverged significantly away from it.
Matching compressor operation to design-point conditions maximizes efficiency and stall margin.
Performance Measurement Methods
Reliable compressor maps and efficiency numbers start with how you measure the machine. NASA compressor test rigs, for example, use comprehensive instrumentation:
- Torque meters for shaft power
- Five-hole probes for total pressure, flow pitch, and swirl
- Total pressure and temperature rakes at inlet and exit planes
- Static taps for wall pressure distribution
- Calibrated bellmouth or venturi for mass flow
- Tachometers for shaft speed
One NASA facility reported uncertainties of 0.034% for pressure, 0.4% for temperature, 0.25% for velocity, and 0.3% for mass flow. Those figures are rig-specific and depend on calibration, installation, and data reduction methods.
Measurement Process
- Establish test conditions (speed, inlet pressure/temperature, back pressure)
- Acquire steady-state or transient data at multiple operating points
- Account for installation effects, blockage, and probe interference
- Convert measured pressures and temperatures into performance metrics with gas property equations
Calculation Methodology
Engineers apply the ideal gas law, isentropic relations, and real-gas corrections to compute pressure ratio, temperature ratio, mass flow, work input, and efficiency. Corrected parameters then normalize results to standard conditions so tests can be compared across facilities and days.
Uncertainty Analysis
ASME PTC 10-2022 is the standard for thermodynamic performance testing of axial and centrifugal compressors. It requires test-specific uncertainty analysis covering instrumentation accuracy, data-reduction propagation, and repeatability.
Achievable accuracy depends on measurement quality, instrumentation, and flow uniformity—no single universal uncertainty value applies to all tests. Tight uncertainty bands are what make reported efficiency and map data trustworthy for design decisions.

Optimization Strategies for Enhanced Performance
Aerodynamic Optimization
Engineers refine blade shapes, endwall contouring, and variable geometry to improve efficiency and range. Variable inlet guide vanes (IGVs) and variable stator vanes (VSVs) adjust flow angles across operating conditions, reducing incidence losses and expanding the stable operating envelope.
Simultaneous IGV and diffuser-vane adjustment expands operating range while improving efficiency across multiple operating points.
Component matching plays a critical role in real-world performance. NASA attributed a 2.4-point CFD-to-test efficiency gap in a centrifugal stage to impeller/diffuser mismatch, incidence, unsteady interaction, and potential bend separation—demonstrating the value of component rematching and unsteady analysis for efficiency recovery.
Control System Strategies
These aerodynamic improvements require sophisticated control systems to maintain stable operation across the full performance envelope.
Modern compressors use active control to maximize performance while maintaining safe margins. Strategies include:
- Scheduling pressure ratio versus corrected speed
- Active surge control through sensing and actuation
- Optimized bleed-valve operation to manage range
- Fuel-flow and variable-geometry schedules tailored to the compressor map
Operating margin prevents surge-line crossing but also prevents operation at maximum efficiency.
Control validation must therefore use the specific compressor map, as no transferable percentage benefit applies universally.
Simulation-Based Exploration
Physics-based simulation platforms let engineers explore design changes, control laws, and operating scenarios before committing to hardware. Component-based models allow rapid re-parameterization of compressor geometry, stage count, and control logic.
Modern simulation tools provide:
- Transient analysis revealing surge-margin behavior and pressure spikes
- Thermal lag modeling during throttle movements or load changes
- Performance data export for control strategy validation
- Predicted efficiency gains compared against test targets
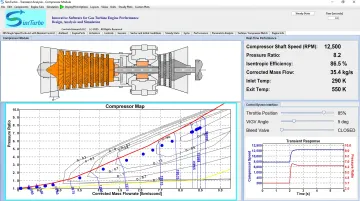
SimTurbo's component-based architecture supports this iterative design approach, allowing engineers to test compressor matching scenarios and control strategies in real time on standard PCs.
Simulation and Modeling Tools for Performance Analysis
Physics-based simulation has become essential in modern compressor design. Component-level modeling allows engineers to represent compressors, turbines, combustors, and control systems as interconnected modules rather than black-box approximations.
That transparency supports detailed analysis of:
- Compressor maps, corrected flow, and pressure ratios
- Efficiency under steady-state and transient conditions
- Operating lines and real-time surge margin
- Efficiency losses before hardware reaches the test stand
Advanced platforms integrate thermodynamic solvers with control-system design for real-time simulation and hardware-in-the-loop validation. SimTurbo, for example, lets engineers build component-based gas turbine models, run transient simulations, and check results against test data.
Validation against NASA J85-GE-21 engine data stays within ±2% for thrust, flow rate, temperature, and thrust-specific fuel consumption. That accuracy supports design iteration, control-law development, and academic instruction without the cost and lead time of physical testing.
Tying compressor performance prediction to system-level analysis cuts development risk and shortens the path to validated designs.
Frequently Asked Questions
What is the difference between isentropic and polytropic efficiency in compressors?
Isentropic efficiency compares actual compression work to the ideal reversible, adiabatic work for the entire compressor. Polytropic efficiency represents stage-by-stage efficiency and remains independent of overall pressure ratio, making it a more fundamental measure for comparing multistage compressor performance.
How many stages are typically used in gas turbine axial compressors?
Stage count depends on overall pressure ratio and architecture. The CFM56-5B/-7B uses 4 low-pressure plus 9 high-pressure stages (13 total) for PR 25.2; GE90 variants use a fan, 3–4 intermediate, and 9–10 high-pressure stages for PR 40–42.
What pressure ratios are typical for different compressor types?
NASA measured PR 4.68 in a modern centrifugal research stage. Named axial examples include the J85 at PR 7, CFM56 at 25.2, and GE90 at 40–42. Single transonic axial stages can reach near PR 2.0; prefer named-engine data over generic per-stage ranges.
How does compressor efficiency affect overall gas turbine performance?
MIT's model showed that a 1% increase in compressor efficiency raises cycle thermal efficiency by approximately 0.5%. Compressor work directly reduces net turbine output, so efficiency gains lower fuel consumption and increase available power. Efficiency losses compound across stages, magnifying system-level impact.
What causes compressor surge and how does it impact performance?
Surge occurs when mass flow drops below a critical value at a given pressure ratio. Blade stall lets stored air reverse through the compressor, with oscillations near 10 Hz. That reversal causes immediate performance loss and possible mechanical damage, so normal operation keeps 20–25% surge margin.
How can engineers validate compressor performance predictions?
Validation methods include component rig tests, engine test-stand measurements, comparison with published NASA or manufacturer data, and simulation with validated tools. Uncertainty analysis per ASME PTC 10-2022 keeps results credible. Platforms checked against reference engines (such as SimTurbo’s ±2% match to NASA J85-GE-21 data) help when physical testing is impractical.