TL;DR
- Cycle analysis predicts gas turbine performance, efficiency, and design limits from core thermodynamics
- The Brayton cycle frames operation as compression, heat addition, expansion, and heat rejection
- Pressure ratio, turbine inlet temperature, and component efficiency set the efficiency–constraint tradeoff
- Real-time simulation speeds design loops with live visualization and control validation
- Component-based models expose flow paths and thermo links instead of black-box results
What Is Gas Turbine Cycle Analysis?
Gas turbine cycle analysis applies thermodynamic principles to predict and optimize the performance of gas turbine engines. Engineers examine compression, combustion, expansion, and exhaust to determine power output, efficiency, and fuel consumption.
The Brayton cycle represents the thermodynamic model that describes gas turbine operation. Most modern passenger and military aircraft are powered by gas-turbine engines, and the same fundamental cycle applies to marine propulsion and stationary power generation.
Engineers apply cycle analysis across several sectors:
- Aerospace: Jet engine and turboprop performance prediction
- Marine propulsion: Naval and commercial vessel power plants
- Power generation: Utility-scale and distributed generation studies
- Education and research: University programs and lab coursework
In the United States, simple-cycle gas turbines reached 132,274 MW of installed capacity in December 2022. Capacity factors exceeded 20% during peak summer months for the first time, underscoring how gas turbines meet flexible grid demand.
Why Gas Turbine Cycle Analysis Is Critical in Engine Design
Cycle analysis gives engineers the foundation to make sound design decisions and avoid costly development errors across the engine lifecycle.
NASA estimates that multidisciplinary simulation could reduce design and development time and cost by approximately 30-40%—more than one year and $100 million in savings—through fewer redesigns, retests, and hardware rebuilds.
Key benefits include:
- Predict thrust, power, efficiency, and fuel burn targets before any hardware is built
- Cut operating cost through thermodynamic optimization—GE reports the GE9X delivers up to 10% better specific fuel consumption than the GE90-115B
- Size compressors, turbines, and combustors from performance requirements rather than guesswork
- Weigh trade-offs among power, thermal efficiency, weight, and material limits
- Ground control algorithms in cycle models and support hardware-in-the-loop testing
Those gains show up in both design-point and off-design work. NASA's design-point cycle analysis uses requirements and component choices to size hardware at key mission points; off-design analysis then predicts performance across the rest of the envelope once those choices are locked.
How Gas Turbine Cycle Analysis Works: The Brayton Cycle
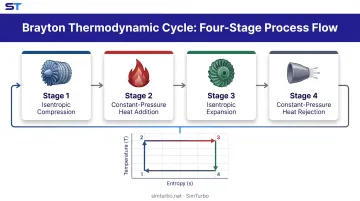
Gas turbine engines operate on the Brayton thermodynamic cycle, consisting of four distinct processes that convert thermal energy into mechanical work.
The four processes are:
- Isentropic compression
- Constant-pressure heat addition
- Isentropic expansion
- Constant-pressure heat rejection
Process 1: Isentropic Compression
Air enters the compressor where pressure and temperature increase while entropy remains constant in the ideal case. Compression is adiabatic and reversible, so no heat transfer occurs and the path is isentropic on the T-s diagram.
Real compressors experience irreversibilities from friction and heat transfer, causing actual compression to deviate from the ideal vertical line on a T-s diagram. This inefficiency requires more work input than the theoretical minimum.
Process 2: Constant Pressure Heat Addition
Compressed air enters the combustion chamber where fuel burns at constant pressure, raising gas temperature. The Brayton cycle idealizes combustion as constant-pressure heat addition, moving horizontally to the right on a T-s diagram.
That heat addition sets turbine inlet temperature (TIT), the peak temperature in the cycle, which is capped by turbine blade material limits. NASA research on silicon-carbide ceramic matrix composites (SiC/SiC CMC) cites target capabilities of 1482–1648°C, at least 100°C above single-crystal nickel-base superalloys.
Process 3: Isentropic Expansion
High-temperature, high-pressure gases expand through the turbine in an adiabatic, reversible process. The turbine extracts work to drive the compressor and produce net power output. In aircraft engines, remaining energy accelerates exhaust gases to generate thrust; in power plants, it drives a generator.
Real turbines experience pressure losses and heat transfer, reducing the actual work extracted below the ideal isentropic expansion.
Process 4: Constant Pressure Heat Rejection
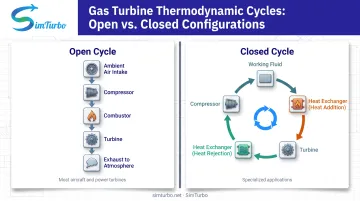
Exhaust gases are expelled to the atmosphere in open-cycle configurations or cooled via heat exchanger in closed cycles, returning to ambient conditions. This constant-pressure cooling completes the thermodynamic cycle by rejecting waste heat.
Most gas turbine engines operate as open cycles, continuously drawing fresh air and expelling exhaust rather than recirculating working fluid.
Key Parameters and Performance Metrics in Cycle Analysis
Several critical parameters define gas turbine performance and serve as optimization targets during cycle analysis.
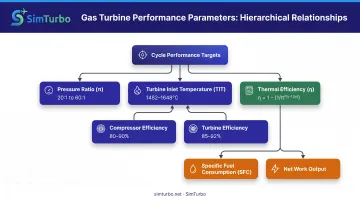
Pressure Ratio (π): The ratio of compressor discharge pressure to inlet pressure sets thermal efficiency potential. Higher ratios improve efficiency but raise compressor work, weight, cost, and complexity.
Real engines span a wide range:
- GE9X: overall pressure ratio above 60:1
- Siemens SGT-700: 19.7:1 to 20.4:1
- Siemens SGT-750: 24.9:1 to 25.6:1
Industrial machines typically run lower ratios than large commercial turbofans.
Turbine Inlet Temperature (TIT): The maximum temperature in the cycle is limited by turbine material constraints. Raising TIT improves both power output and efficiency, so advanced materials and cooling technologies unlock further gains.
Thermal Efficiency (η): The ratio of net work output to heat input. For the ideal Brayton cycle with constant specific heats, thermal efficiency is η = 1 - 1/[π^((γ-1)/γ)], where γ is the specific heat ratio (about 1.4 for air at standard conditions). Efficiency rises with pressure ratio, though real engines hit practical limits.
NASA cautions that γ depends on gas state, and assuming a single constant value for hot combustion products introduces significant error at higher pressures.
Specific Fuel Consumption (SFC): Fuel flow rate per unit of thrust or power output. Lower SFC means better operational economics. Aerospace engineers track thrust-specific fuel consumption (TSFC); power generation focuses on heat rate or fuel per kilowatt-hour.
Component Efficiencies: Real compressors and turbines lose performance to irreversibilities. Turbine efficiency is actual work divided by ideal work; compressor efficiency is ideal work divided by actual work. Those losses cut net work and pull overall cycle efficiency below the ideal Brayton value.
Practical Applications of Gas Turbine Cycle Analysis
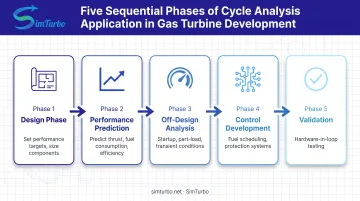
Cycle analysis supports engine work from first design targets through development testing and in-service operation—setting performance goals, checking design choices, and guiding controls.
Design Phase Applications
Engineers use cycle analysis to establish baseline performance targets, select component configurations, and optimize pressure ratios for specific mission profiles. NASA's design-point approach uses operational requirements to size engine components at key mission points, balancing efficiency, power output, weight, and cost constraints.
Component choices follow directly from those cycle results:
- Compressor stage counts
- Turbine blade designs
- Combustor configurations
- Cooling schemes
Performance Prediction
Cycle analysis predicts key outputs across operating conditions:
- Thrust and power output
- Fuel consumption
- Thermal and propulsive efficiency
NASA cycle models take fuel flow plus altitude, Mach number, and deviation from standard-day temperature as inputs, then use performance maps to predict behavior at each flight condition.
This capability allows engineers to evaluate how engines will perform during takeoff, cruise, and landing, or how stationary turbines will respond to ambient temperature changes and grid load variations.
Off-Design Analysis
Real engines operate at various conditions beyond the design point. Off-design analysis predicts performance during startup, part-load operation, and transient conditions. NASA notes that compressor and turbine maps are required for off-design prediction, and scaled generic maps can accumulate significant error away from the design point.
Off-design results show whether the engine still meets targets across the full envelope and give control engineers the data they need for safe fuel scheduling and protection logic.
Control System Development
Cycle models provide the foundation for developing engine control algorithms, validating control strategies, and enabling simulation-based testing. NASA demonstrated connecting an NPSS engine plant model to MATLAB/Simulink for control loop development, though time-step synchronization proved challenging.
Engineers—and platforms such as SimTurbo—use cycle models to prove out control laws before hardware runs:
- Fuel scheduling
- Variable geometry actuation
- Engine protection systems
How SimTurbo Supports Gas Turbine Cycle Analysis
SimTurbo is a Windows-based simulation platform that lets engineers and students run gas turbine cycle analysis with real-time visualization. Developed by Controls Research LLC in Frankfort, Illinois, it prioritizes transparent, component-level modeling over black-box tools.
Users build engine configurations with a drag-and-drop interface from individual components and controls:
- Compressors, combustors, turbines, nozzles, recuperators, and afterburners
- PID controllers, limiters, actuators, and sensors
Thermodynamic relationships and flow paths stay visible, so you can see how each component choice affects overall cycle performance.
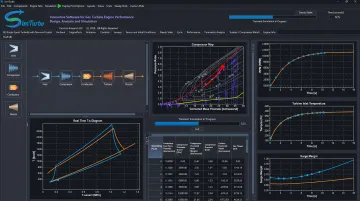
Engineers run transient and steady-state simulations on standard PCs while watching interactive graphs and T-s diagrams. The platform plots operating points on compressor and turbine maps and shows how the Brayton cycle shifts during throttle changes or afterburner engagement.
It also tracks RPM, temperature, and surge margin in real time.
SimTurbo's algorithms have been validated against NASA Lewis Research Center J85-GE-21 engine test data, with reported accuracy within ±2% for thrust, flow rate, temperature, and thrust-specific fuel consumption. Results are intended to track real engine behavior closely enough for design and teaching use.
Universities use the platform for propulsion and thermodynamics courses, capstone projects, and research programs. Aerospace, marine, and power generation engineers apply it for design analysis, control validation, and virtual prototyping before physical testing.
Licensing options include:
- 30-day free trial at $0
- Monthly subscription at $59.99
- One-year license at $599
- Lifetime license at $5,999 with free upgrades and support
Educational discounts and customized class or lab programs are available for academic institutions.
Conclusion
Gas turbine cycle analysis built on the Brayton cycle supports efficient engine design across aerospace, marine, and power generation. Engineers use thermodynamic models to forecast performance and validate control strategies before committing to physical prototypes.
Platforms like SimTurbo speed that work. Teams can iterate designs quickly, visualize thermodynamic behavior, and cut development risk without waiting on hardware.
Frequently Asked Questions
What is an ideal Brayton cycle?
The ideal Brayton cycle is a thermodynamic model consisting of isentropic compression, constant-pressure heat addition, isentropic expansion, and constant-pressure heat rejection. It represents gas turbine operation without losses from friction, heat transfer, or pressure drops.
How do you calculate Brayton cycle efficiency?
Ideal Brayton cycle thermal efficiency is η = 1 - (1/π^[(γ-1)/γ]), where π is the pressure ratio and γ is the specific heat ratio (typically 1.4 for air). Efficiency rises with pressure ratio, though real engines are limited by component losses and material temperature caps.
Why is the Brayton cycle used in gas turbines?
The Brayton cycle matches the continuous-flow path in gas turbines: compression, combustion, and expansion. That layout delivers high power-to-weight ratios suited to aviation and power generation, with smoother output than reciprocating engines.
What is the difference between ideal and actual Brayton cycles?
Actual cycles include irreversibilities from friction, heat transfer, and pressure losses, so performance falls below the ideal case. Engineers apply component efficiencies (often about 80–90% of ideal for compressors and turbines), which means more fuel is needed for the same power.
How does pressure ratio affect gas turbine performance?
Higher pressure ratio improves thermal efficiency and specific work, but it also raises compressor work and turbine inlet temperature. Optimal ratio depends on material limits, component efficiency, weight, and mission needs. Modern aerospace engines can exceed 60:1; industrial units often run about 20:1 to 26:1.
What software tools are used for gas turbine cycle analysis?
Engineers use specialized platforms such as SimTurbo, GasTurb, and NPSS (Numerical Propulsion System Simulation), plus general tools like MATLAB/Simulink, for cycle analysis, design optimization, and controls work. Choice usually depends on modeling fidelity, workflow, and how tightly the tool integrates with the rest of the design stack.