When done correctly, performance analysis delivers measurable financial returns. GE Vernova reports fuel savings of $100K–$500K through heat-rate optimization software, demonstrating how precision in measurement and calculation directly impacts the bottom line. Whether you're validating a new design, troubleshooting existing equipment, or planning maintenance interventions, understanding how to evaluate efficiency, power output, and component health is essential.
Key Takeaways
- Measures efficiency, power output, and engine health through systematic thermodynamic calculation
- Core metrics: thermal efficiency, specific fuel consumption, pressure ratio, and component efficiencies
- Workflow spans data collection, cycle calculations, baseline comparison, and diagnostic interpretation
- Tools like SimTurbo support real-time analysis within ±2% of NASA test data
- Performance trending flags degradation early and times maintenance before failure
What Is Gas Turbine Performance Analysis?
Gas turbine performance analysis is the systematic evaluation of engine efficiency, power output, and thermodynamic behavior using measured data and established thermodynamic principles. Engineers collect pressure, temperature, flow, and fuel data, then apply Brayton cycle relationships to calculate thermal efficiency, heat rate, specific fuel consumption, and component performance.
Work typically falls into two categories:
Design-point analysis evaluates performance at ISO standard reference conditions (101.325 kPa, 15°C, 60% relative humidity), enabling direct comparison to manufacturer guarantees and specifications. This establishes the baseline against which all future performance is measured.
Off-design analysis examines actual operating conditions, including ambient temperature, altitude, load, and fuel composition. NASA defines off-design analysis as examination of the overall operating envelope after component design decisions are complete. It predicts performance outside the original cycle design and checks operation against system constraints.
Performance analysis and condition monitoring answer different questions. Condition monitoring tracks vibration, oil debris, and component wear to catch mechanical deterioration. Performance analysis measures thermodynamic efficiency: how well the engine turns fuel into useful work.
The two methods complement each other. Performance trends often flag problems before mechanical symptoms show up.
Engineers apply performance analysis across five primary scenarios:
- New engine design validation and certification testing
- Existing engine optimization and efficiency improvement
- Troubleshooting performance degradation and anomalies
- Control system development and tuning across operating ranges
- Academic research and student education in propulsion and thermodynamics
Why Gas Turbine Performance Analysis Is Critical
Performance analysis turns thermodynamic measurements into decisions on efficiency, operating cost, and uptime across aerospace, marine, and power generation. Systematic analysis matters because it:
- Flags fouling, erosion, and seal leakage early by trending efficiency, pressure ratio, and temperature before components fail
- Cuts fuel use by finding and correcting efficiency losses, critical when fuel is 60–80% of lifecycle operating costs in power generation
- Confirms engines meet specs and performance guarantees, avoiding redesigns and warranty claims
- Supplies measured trends for tuning fuel scheduling, acceleration limits, and temperature protection across the envelope
- Supports emissions reporting, environmental permitting, and performance-guarantee checks for regulators and customers
- Quantifies degradation rates so cleaning, inspection, and overhaul timing reduce planned and unplanned downtime
How Gas Turbine Performance Analysis Works – Step by Step
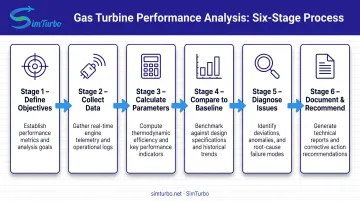
Performance analysis follows a structured engineering workflow from objective definition through diagnostic recommendations. Understanding each stage (and the common mistakes that compromise results) ensures accurate, actionable conclusions.
Step 1 – Define Analysis Objectives and Scope
Start by clarifying the decision the analysis must support. Are you quantifying efficiency degradation over six months? Verifying that a new engine meets guaranteed power output? Diagnosing why exhaust temperature has increased?
Each question shapes which measurements you collect, which conditions you test, and how you interpret results.
Identify the operating conditions to analyze. Base load, part load, transient startup, and full-envelope mapping each require different test points and instrumentation. Establish your baseline for comparison: ISO conditions, manufacturer design curves, previous test data, or historical trends from the same engine.
Common mistakes at this stage:
- Skipping baseline definition, making it impossible to distinguish normal variation from real degradation
- Testing at only one operating point when the problem appears across multiple loads
- Failing to document ambient conditions, fuel composition, and configuration changes that affect comparisons
Metrics impacted: Result clarity, decision relevance, and wasted test effort.
Step 2 – Collect Measurement Data
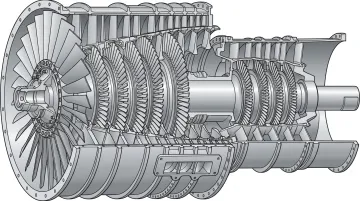
Accurate thermodynamic analysis demands accurate measurements. You'll need pressures, temperatures, mass flows, fuel composition, ambient conditions, and shaft speed or power output at key stations: compressor inlet and discharge, combustor exit, turbine inlet and exhaust, and nozzle.
Sensor accuracy and calibration status directly affect result confidence. ASME field-testing research indicates that pressure and temperature measurement accuracy propagates into final test-result uncertainty, with total engine-power uncertainty as low as 1% when torque meters are used.
Evaluate instrumentation for the actual test arrangement. Universal tolerances don't exist.
Apply ambient corrections to normalize data to reference conditions. Inlet air temperature, pressure, and humidity directly impact air density and mass flow, which changes power output and efficiency. GE documentation shows that 10 mbar inlet pressure loss causes 1.42% output loss and 0.45% heat-rate increase. These model-specific effects must be accounted for in every analysis.
Common mistakes:
- Using uncalibrated sensors or instruments past calibration dates
- Ignoring ambient corrections, comparing winter and summer data directly
- Skipping fuel composition analysis when fuel properties significantly affect heat rate
- Measuring at the wrong stations or with insufficient spatial resolution
Metrics impacted: Data quality, calculation accuracy, and diagnostic confidence.
Step 3 – Calculate Thermodynamic Performance Parameters
Apply thermodynamic relationships to the corrected data to calculate the metrics that reveal engine health. Start with overall cycle performance:
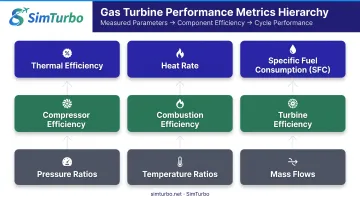
- Thermal efficiency: Ratio of useful work output to fuel energy input (work out ÷ fuel energy in)
- Heat rate: Inverse of thermal efficiency, expressing fuel energy required per unit work (fuel energy in ÷ work out)
- Specific fuel consumption (SFC): Fuel mass flow per unit power output, indicating fuel economy
Then calculate component-level metrics:
- Pressure and temperature ratios: Compressor discharge ÷ inlet pressure; turbine inlet ÷ compressor inlet
- Compressor efficiency: Actual pressure rise versus isentropic ideal
- Turbine efficiency: Actual work extraction versus isentropic potential
- Combustor efficiency: How completely fuel energy converts to thermal energy
Determine mass flow through continuity equations, correcting for actual gas properties (specific heat, gas constant, and ratio of specific heats) which vary with temperature, pressure, and fuel composition.
Common mistakes:
- Using constant gas properties when actual values change significantly with temperature
- Applying isentropic relations without correcting for real-gas effects
- Neglecting pressure losses in ducts, filters, and transitions
- Calculating component efficiency with measurements from the wrong stations
Metrics impacted: Efficiency accuracy and validity of baseline or spec comparisons.
Step 4 – Compare Results to Baseline or Expected Performance
Plot measured performance against design curves, previous test data, or ISO-corrected manufacturer data. Calculate performance deltas and degradation percentages for key parameters. If thermal efficiency dropped from 38.5% to 36.2%, that is a 2.3 percentage-point absolute decline, or about 6% relative degradation.
Identify which components or stages show the greatest deviation. Did compressor pressure ratio decline while turbine performance remained stable? Did heat rate increase uniformly across all loads, or only at part load? These patterns point to specific root causes.
Performance mapping across the operating envelope (multiple speeds, loads, and ambient conditions) reveals whether degradation affects all conditions equally or appears only in certain regimes.
Common mistakes:
- Comparing uncorrected data to ISO-rated specifications
- Treating normal seasonal variation as degradation
- Focusing only on overall efficiency without isolating component contributions
- Failing to account for configuration changes, fuel switches, or control-system modifications
Metrics impacted: Anomaly detection, root-cause isolation, and action priority.
Step 5 – Interpret Results and Diagnose Issues
With performance deltas quantified, the diagnostic work begins. Analyze patterns in the data:
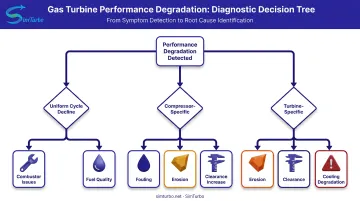
- Uniform vs. localized degradation: Does efficiency decline uniformly across the cycle, or does one component show disproportionate losses?
- Gradual vs. sudden changes: Gradual decline suggests fouling or erosion; sudden drops indicate mechanical damage or control issues
- Load dependence: Problems that worsen at part load often indicate control or combustion issues; full-load problems suggest capacity or flow limitations
Correlate performance changes with potential root causes. Research on fault signatures shows that compressor fouling, erosion, and increased clearance generally produce lower corrected flow and lower efficiency, while turbine erosion and increased clearance produce higher corrected flow and lower efficiency.
Because fault signatures overlap, corrected flow and efficiency alone don't uniquely identify the physical cause. Integrate performance analysis with inspection history, operating events, and condition-monitoring data.
Common mistakes:
- Diagnosing based on one parameter in isolation
- Confusing correlation with causation
- Ignoring recent maintenance, trips, or operating changes that explain performance shifts
- Failing to validate diagnoses with follow-up inspection or testing
Metrics impacted: Diagnostic accuracy, maintenance decisions, and cost of corrective action.
Step 6 – Document Findings and Recommend Actions
Prepare a clear analysis report with performance trends, efficiency calculations, comparison to baseline, and specific recommendations. Options typically include:
- Continue operation: Performance within acceptable limits, no action required
- Perform cleaning: Compressor wash restores 85-95% of fouling-related losses
- Inspect components: Schedule borescope or field inspection to confirm suspected damage
- Adjust controls: Retune fuel scheduling, temperature limits, or acceleration schedules
- Plan outage: Major repair or component replacement required
Establish monitoring frequency and trigger points for future analysis or intervention. For critical power-generation units, monthly trending may be appropriate. Industrial applications may need only quarterly analysis, with extra tests triggered by trips, load changes, or efficiency alarms.
Common mistakes:
- Providing vague recommendations without specific action items or timelines
- Failing to quantify expected performance recovery from recommended actions
- Omitting cost-benefit analysis to support maintenance decisions
- Not establishing clear triggers for follow-up analysis
Metrics impacted: Uptime, maintenance effectiveness, and lifecycle cost.
Key Performance Metrics Explained
Every gas turbine engineer must understand and calculate these fundamental metrics correctly. They form the language of performance analysis and enable meaningful comparison across engines, time, and operating conditions.
Thermal Efficiency and Heat Rate
Thermal efficiency is the ratio of useful work output to fuel energy input (work out ÷ fuel energy in). Higher thermal efficiency means more of the fuel's chemical energy converts to useful work.
Heat rate is the inverse: fuel energy required per unit work (fuel energy in ÷ work out). Lower heat rate indicates better performance.
Both measure the same thermodynamic performance from different perspectives. Power-generation engineers typically use heat rate because it directly ties fuel consumption to electricity production; aerospace engineers favor thermal efficiency when comparing cycle concepts.
Representative values vary by engine class and cycle configuration:
- Siemens SGT-300 industrial turbine: 30.8% efficiency, 11,704 kJ/kWh heat rate
- Siemens SGT-800 industrial turbine: 40.1–41.1% efficiency, 8,759–8,970 kJ/kWh heat rate
- GE LM2500 aeroderivative: 39.0–39.4% net LHV efficiency, 8,669–8,751 Btu/kWh heat rate
- Advanced aircraft gas turbines: up to 55% thermodynamic efficiency (separate from propulsive efficiency)
U.S. fleet-average operating heat rates: 7,146 Btu/kWh for combined-cycle systems, ~10,000 Btu/kWh for simple-cycle. These operating averages include degradation and part-load operation, so they should not be compared directly to clean, ISO-rated OEM guarantees.
Specific Fuel Consumption (SFC)
Specific fuel consumption is fuel mass flow per unit power output, indicating fuel economy. For thrust-producing engines (turbojets, turbofans), it's expressed as thrust-specific fuel consumption (TSFC): fuel mass ÷ thrust. For shaft-power turbines, it's brake-specific fuel consumption (BSFC): fuel mass ÷ shaft power.
NASA identifies benchmark sea-level-static TSFC values of 1.0 lbm/(lbf·h) for turbojets and 0.5 lbm/(lbf·h) for turbofans, though TSFC changes significantly with speed and altitude.
SFC increases at part-load because fixed losses (compressor work, cooling flows, accessory loads) consume a larger fraction of fuel energy as power output declines. Research indicates inefficient part-load operation can raise SFC more than 20% above design values, depending on engine design and control strategy.
That pattern guides economic dispatch: operators often prefer running fewer units at higher load rather than many units at low part-load.
For industrial and power-generation turbines, OEMs typically publish heat rate instead of mass-based SFC because heat rate accounts for fuel heating value directly, while converting heat rate to mass SFC requires knowing fuel lower heating value (LHV) and hydrogen-to-carbon ratio.
Pressure Ratio and Turbine Inlet Temperature
Pressure ratio (compressor discharge pressure ÷ inlet pressure) and turbine inlet temperature (TIT) are the two major cycle-performance variables that drive efficiency. Higher pressure ratios and TITs generally improve thermal efficiency by widening Brayton-cycle temperature and pressure differentials and extracting more work per unit mass of air.
However, higher TIT increases material stress, requires advanced cooling schemes, and demands exotic alloys and thermal barrier coatings. A DOE/GE H-system report specifies a 1,430°C (2,600°F) firing temperature at 23:1 pressure ratio, using closed-loop steam cooling, single-crystal first-stage alloys, and thermal barrier coatings to support the firing temperature while keeping bulk metal temperatures lower.
Definitions matter: firing temperature, combustor-exit temperature, and rotor-inlet temperature differ based on measurement location and cooling-flow mixing. TIT ranges vary widely across engine classes. Heavy-duty industrial, aeroderivative, and advanced aircraft engines each operate in different temperature regimes, so cross-class generalizations are not valid without specific references.
Component Efficiencies
Overall cycle efficiency breaks down into compressor efficiency, combustion efficiency, and turbine efficiency. When any component degrades, overall performance suffers—performance analysis isolates which component is degrading and by how much.
- Compressor efficiency: Compares actual pressure rise to the isentropic (ideal) pressure rise for the same work input
- Combustion efficiency: Measures how completely fuel energy converts to thermal energy (typically >99% for well-designed combustors)
- Turbine efficiency: Compares actual work extraction to the isentropic work potential for the same pressure drop
Modern aircraft compressor and turbine efficiencies are around 90%, with research suggesting better than 95%. Foundational NASA Brayton-cycle studies assumed 88% compressor and 90% turbine polytropic efficiency as representative values.
Degradation impacts vary by component and severity. ASME research on combined-cycle plants found that 5% compressor isentropic-efficiency degradation produced approximately 4.9% reduction in engine power and 3.3% reduction in engine efficiency. This is a studied plant response, not a universal transfer function—actual sensitivity depends on cycle pressure ratio, TIT, and configuration.
Performance Analysis Example Walkthrough
Scenario: An industrial gas turbine in power generation shows a 3% reduction in power output and a 5% increase in heat rate over six months. The plant manager requests performance analysis to diagnose the cause and recommend corrective action.
Data collection: Engineers measure ambient conditions (15°C, 101.3 kPa, 60% RH, close to ISO reference), plus pressures and temperatures at compressor inlet, compressor discharge, combustor exit, and turbine exhaust. They also record fuel flow, composition (natural gas, LHV 50 MJ/kg), shaft speed, and generator output.
Calculation sequence:
- Correct to ISO conditions: Ambient conditions are already near ISO reference, so corrections are minimal.
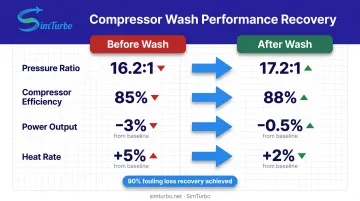
- Calculate pressure ratio: Compressor discharge pressure ÷ inlet pressure = 16.2:1, down from the design value of 17.5:1.
- Determine compressor efficiency: Using measured temperatures and pressures, calculate actual temperature rise and compare to isentropic ideal. Result: 85% efficiency, down from design 89%.
- Determine turbine efficiency: Calculate actual work extraction and compare to isentropic potential. Result: 88%, matching design with no turbine degradation detected.
- Compute thermal efficiency: Net work output ÷ fuel energy input = 36.5%, down from baseline 38.5%.
Diagnosis: Compressor pressure ratio declined 7.4% and compressor efficiency dropped 4.5%, while turbine performance stayed on target. That signature matches compressor fouling, which reduces airflow, lowers pressure ratio, and degrades cycle efficiency. The 3% power loss and 5% heat-rate increase line up with the calculated compressor decline.
Recommended action: Perform an offline compressor water wash to remove accumulated deposits. Historical experience at this plant shows washing typically restores 90% of fouling-related losses.
Outcome: After washing, pressure ratio recovered to 17.2:1 and compressor efficiency improved to 88%. Power output returned to within 0.5% of baseline, and heat rate fell to 2% above baseline. The results confirmed both the diagnosis and the analysis method.
How SimTurbo Can Help
SimTurbo is an engineer-friendly gas turbine simulation platform that speeds performance analysis with real-time modeling, a component-based architecture, and validated thermodynamic solvers. Built by Controls Research LLC under founder Paul J. Hoffman (45+ years in aerospace, automotive, and power systems), it connects field measurements to physics-based prediction.
Key Capabilities for Performance Analysis
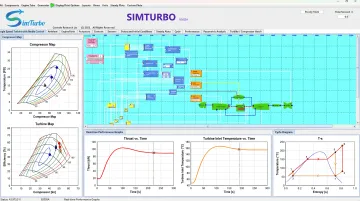
Real-time simulation on standard PCs lets you evaluate operating scenarios and design alternatives quickly. Interactive graphs update as conditions change, so thermodynamic trends show up immediately. You can model:
- Steady-state performance and throttle response
- Transient startup, shutdown, and compressor stall
- Control-system behavior without test-cell time or hardware risk
Component-based architecture analyzes individual stages (compressor, combustor, turbine, nozzle) instead of treating the engine as a black box. Supporting views include:
- Compressor and turbine maps (corrected mass flow, pressure ratio, efficiency)
- Performance tables (altitude, Mach number, corrected speed)
- Cycle diagrams (T-S and P-V) comparing isentropic and real processes
Validation against NASA test data builds confidence in the results. SimTurbo’s J85-GE-21 single-spool turbojet model matched NASA Lewis Research Center data within ±2% for thrust, flow rate, temperature, and TSFC—tight enough for design checks and troubleshooting.
Supported configurations include single- and dual-spool turbojets, recuperated and regenerated cycles, afterburners, and layouts with intercoolers or reheaters. The solver includes real-gas effects, component maps, and pressure losses so outputs track real engine physics.
Benefits for Engineering Teams
Teams use SimTurbo to move from measurement and theory to decisions faster:
- Faster design loops: What-if changes to pressure ratio, firing temperature, efficiency, or fuel take minutes, not weeks, before you commit to hardware
- Control-law checks: Built-in PID controllers, limiters, actuators, and sensors support fuel scheduling, temperature protection, acceleration logic, and FADEC-style responses
- HIL-ready workflows: Export transient RPM, EGT, thrust, and SFC to CSV or Excel; use plant responses to validate external control laws
- Classroom access: University pricing and seat-based cloud licenses fit thermodynamics courses, propulsion labs, capstones, and faculty research
- Tooling fit: Send results to Excel, MATLAB/Simulink, or Python for custom post-processing, optimization, or stats
- Low-risk trial: Full-functionality 30-day trial at $0 so students and engineers can evaluate before buying
For aerospace, marine, and power-generation work, that mix of scenario runs, component diagnostics, and control validation sits alongside field data—not in place of it.
Conclusion
Gas turbine performance analysis turns measured pressures, temperatures, and flows into clear signals about efficiency, power capability, and component health. Collect accurate data, calculate thermodynamic parameters, compare results to baseline, and interpret performance signatures—and you can detect degradation early, cut fuel waste, validate designs, and guide maintenance.
Regular performance trending supports proactive intervention before small problems escalate. Monthly checks suit critical power generation; quarterly reviews fit many industrial plants; and you should always reassess after major events such as maintenance or trips.
Modern simulation tools like SimTurbo complement field measurements by speeding what-if analysis, isolating component contributions, and validating control strategies with real-time, physics-based modeling. Whether you are chasing a 5% heat-rate increase or designing the next propulsion system, disciplined performance analysis keeps every decision grounded in data.
Frequently Asked Questions
What is the difference between thermal efficiency and heat rate in gas turbine performance?
Thermal efficiency is work output divided by fuel energy input (higher is better). Heat rate is the inverse: fuel energy per unit work (lower is better). Power-generation engineers usually prefer heat rate because it ties fuel use directly to electricity produced.
How do ambient conditions affect gas turbine performance analysis?
Inlet air temperature, pressure, and humidity change air density and mass flow, which shifts power output and efficiency. For valid comparisons, correct measured data to ISO conditions (101.325 kPa, 15°C, 60% RH), including inlet and exhaust losses that can move results by 1–2%.
What measurement data is required to perform accurate gas turbine performance analysis?
Essential parameters include compressor and turbine inlet/discharge pressures and temperatures, fuel flow and composition (especially lower heating value), ambient conditions, shaft speed, and power output. With calibrated sensors, total uncertainty can stay near 1%.
Can performance analysis predict component failures before they occur?
It measures thermodynamic health more than mechanical condition, but trends in efficiency, pressure ratio, or temperatures can flag fouling, erosion, or seal leakage early. Pairing it with vibration and oil-debris monitoring gives a fuller health picture.
How often should gas turbine performance analysis be conducted?
Run it continuously or monthly for critical power generation, quarterly for most industrial units, and after outages, trips, large load swings, or efficiency alarms. ASME PTC 22 covers absolute and comparative tests but does not set a universal calendar interval.
What are the advantages of using simulation software for gas turbine performance analysis?
Tools like SimTurbo let you evaluate design options, validate control strategies, and predict off-test conditions with physics-based models that complement measured data. Real-time, component-based simulation validated within ±2% of NASA test data speeds troubleshooting and control-law work without extra test-cell time.