Introduction
Gas turbine control systems, process lines, and aerospace propulsion networks rely on valves that open, close, and throttle flow millions of times over decades. When a valve cavitates, loses capacity under load, or misses its rated flow coefficient, the result is efficiency loss, unplanned downtime, and expensive field repairs.
CFD valve simulation lets engineers predict those failures before metal is cut. A validated model can surface:
- Pressure drop and flow coefficients (Cv/Kv)
- Cavitation zones and erosion-prone regions
- Flow separation and transient behavior during open/close
- Structural stresses tied to internal loads
That shift—from prototype-heavy iteration to simulation-led design—lets teams explore more geometry options and cut physical test cycles. Experimental rigs still matter for final proof, but they rarely match CFD’s speed or cost for early insight.
This article covers the CFD valve workflow from geometry prep through validation, then shows how system-level tools such as SimTurbo fold valve performance maps into gas turbine control system analysis.
Key Takeaways
- CFD predicts pressure drop, Cv/Kv, cavitation risk, and structural loads before prototyping
- Validated models match test data within 0.5%–5.9% when mesh, turbulence, and boundaries are set correctly
- Globe, ball, butterfly, gate, and check valves each need distinct CFD focus areas for accurate flow data
- IEC 60534-2-1 and ISA-75.02.01 define test conditions and sizing equations—not CFD methods
- Valve maps derived from CFD integrate into system models for complete control-system validation
What Is CFD Valve Simulation for Flow Control?
CFD valve simulation is the computational analysis of fluid flow through valve geometries. It predicts performance parameters such as pressure drop, flow rate, turbulence intensity, cavitation zones, and structural loads.
Engineers use those results to extract flow coefficients (Cv/Kv values), pressure drop curves, velocity profiles, cavitation indices, actuator torque requirements, and temperature distributions before anything is manufactured.
Typical applications include:
- Valve manufacturer R&D and performance certification
- Aerospace propulsion control systems (fuel, bleed air, variable geometry)
- Oil and gas flow control and pipeline isolation
- HVAC system design and power generation control
- Process industries requiring regulatory compliance testing
CFD approaches for valves:
- Steady-state RANS for capacity, pressure loss, and Cv calculation
- Transient analysis for valve opening/closing dynamics and pressure transients
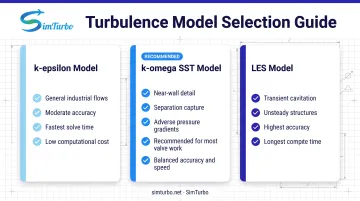
- Turbulence models such as k-epsilon (general flows), k-omega SST (near-wall accuracy), and LES (unsteady structures)
- Multiphase modeling for cavitation, flashing, or two-phase flows
- Fluid-structure interaction (FSI) when trim deformation affects flow capacity
CFD works alongside traditional methods rather than replacing them. Experimental testing remains the validation standard. Empirical correlations still support quick sizing, and analytical equations build conceptual understanding.
What CFD adds is visibility into the internal flow field—so teams can catch design flaws early and refine geometry before physical testing.
Why CFD Valve Simulation Is Critical in Flow Control Engineering
Valve simulation accelerates design iteration, reduces prototype costs, and improves product reliability. In regulated industries, computational validation against standards like ISA-75.02.01 and IEC 60534-2-1 shortens certification cycles.
Key benefits:
- Cuts physical prototype cost by testing design alternatives virtually
- Flags cavitation and erosion zones before manufacturing to prevent field failures
- Optimizes geometry for lower pressure loss, higher flow capacity, and accurate Cv/Kv
- Validates performance against industry standards to speed compliance
- Stress-tests extreme conditions safely, including overpressure, off-design flow, and temperature swings
- Clarifies transient behavior during valve motion, startup, and emergency closure
Real-world evidence: A 2025 study of an industrial solenoid valve found that a 1.3 mm diaphragm deformation under operating load reduced Kv by more than 20%.
The validated CFD model (about 3.27 million cells, k-omega SST turbulence) stayed within 5.9% of experimental data across four operating conditions. That accuracy supported design corrections before production.
How CFD Valve Simulation Works – Step by Step
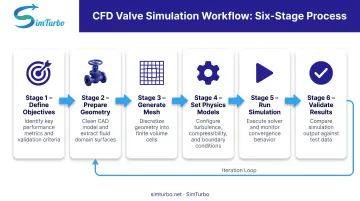
Successful valve CFD is an iteration loop: set up the model, solve, validate, then refine. Most failed runs trace back to a few setup mistakes:
- Oversimplified geometry that erases flow-critical edges
- Coarse mesh near the seat and throttling gaps
- Turbulence models that miss separation or adverse gradients
- Inlet/outlet domains too short, so boundaries distort the solution
Step 1 – Define Simulation Objectives and Performance Metrics
Start by locking what the run must answer and what “good enough” means.
Priority outputs usually include:
- Performance metrics: Cv/Kv, pressure drop, cavitation index, actuator torque
- Operating envelope: pressure, temperature, flow rate, and valve travel positions
- Design levers: seat profile, plug geometry, flow passages
Also fix constraints early—valve type, fluid properties, accuracy targets, validation data on hand, plus compute budget and timeline. Success metrics follow the use case. A manufacturer certifying capacity may need Cv within ±2% of test data. An erosion study needs reliable cavitation-zone location and collapse intensity instead.
Step 2 – Prepare Valve Geometry and Fluid Domain
Import or build 3D CAD that includes the seat, plug or disc, body, and enough upstream/downstream pipe. Capacity-test practice places pressure taps at 2D upstream and 6D downstream; recovery is often complete by 4D–6D, so extend the domain if the outlet boundary still interferes.
Simplify only what does not change internal flow:
- Remove bolts, labels, and external fittings
- Keep seat profile, internal passages, gaps, and throttling edges
Extract the wetted volume with Boolean operations so inlet and outlet extensions support developed flow and full pressure recovery.
Step 3 – Generate Computational Mesh
Pick cell topology for the geometry and accuracy target:
- Tetrahedral — complex shapes, fast turnaround
- Hexahedral — higher accuracy and lower cell count when blocking is practical
- Polyhedral — balanced quality and cost
- Hybrid — structured cores with unstructured regions where needed
Refine where gradients are steep: seat and plug surfaces, narrow gaps, high-velocity jets, and near-wall layers (y+ < 1 for SST; y+ 30–300 for standard k-ε). Then check skewness, aspect ratio, and orthogonal quality, and run at least three mesh densities. A 2025 solenoid-valve study compared 1.3M, 3.0M, and 4.0M cells and kept about 3.27M for production runs.
Step 4 – Set Up Physics Models and Boundary Conditions
Match the turbulence model to the physics you care about:
- k-ε — general industrial flows when moderate accuracy is enough
- k-ω SST — near-wall detail, separation, and adverse pressure gradients
- LES — transient cavitation, unsteady shedding, and erosion work
Set boundary conditions to mirror the test rig: inlet mass flow, velocity, or total pressure; outlet static pressure or outflow; no-slip walls (with roughness if known); symmetry planes only where the geometry truly allows a smaller domain.
Solver choices close the setup—pressure-velocity coupling (SIMPLE, PISO, or coupled), second-order spatial schemes, implicit transient treatment when needed, and clear convergence checks on residuals, mass balance, and monitored outputs. Add time-stepping if the valve itself moves.
Step 5 – Run Simulation and Monitor Convergence
Launch the solver and watch both numerics and engineering quantities. Residuals should fall cleanly, while mass flow, pressure drop, Cv/Kv, and component forces settle to steady values—or stable periodic behavior for unsteady cases.
If the run stalls, tighten the mesh in problem regions, ease under-relaxation, recheck boundary consistency, or restart from a coarser-mesh solution with better initial fields.
Step 6 – Post-Process Results and Validate Against Benchmarks
Post-process for the decisions you defined in Step 1:
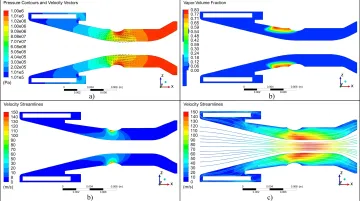
- Pressure contours and velocity vectors
- Streamlines for pathlines and separation
- Vapor volume fraction for cavitation zones
- Wall shear stress as an erosion-risk flag
Derive the performance numbers next—Cv (US gpm of 60°F water at 1 psi drop) or Kv (m³/h at 1 bar drop), resistance and ΔP curves versus travel, and a cavitation index against vapor pressure.
Validate against manufacturer data, published benchmarks, or your own tests, and record uncertainty. A 2014 ball-check valve study reported mass-flow differences under 5%, and under 2% in most cases. When gaps remain, feed them back into geometry, mesh, or model choices and rerun—the loop in Steps 1–6 is the method, not a one-pass checklist.
CFD Valve Simulation – Example Case Walkthrough
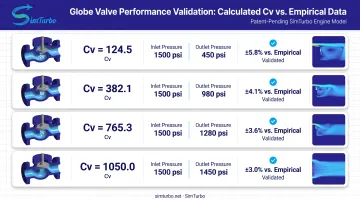
This walkthrough models a globe valve to find Cv at 25%, 50%, 75%, and 100% open for water at standard conditions.
Key simulation decisions:
- Geometry: Keep seat geometry, plug profile, and flow passages; strip external bolts and labels
- Mesh strategy: Refine locally at the seat, plug gap, and downstream recovery region (~2–4 million cells)
- Boundary conditions: Vary inlet velocity for a 1 bar drop; set outlet static pressure; apply material-based wall roughness
- Turbulence model: k-omega SST for near-wall accuracy and separation prediction
Sample results:
- Generated pressure drop vs. flow rate curves at each valve position
- Calculated Cv values using standard definitions
- Mapped separation zones at partial opening, with reduced effective area
- Matched empirical Cv equations within 3–6%, inside typical validation targets
Common pitfall: Downstream pipe shorter than 6D under-predicted pressure recovery and pulled Cv artificially low.
- Problem: recovery plane too close to the valve
- Fix: extend the outlet domain to ~10D and re-check Cv
How SimTurbo Can Support Valve Analysis in System Context
SimTurbo as a Complementary System-Level Tool
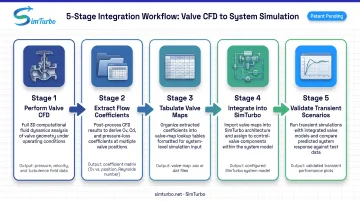
SimTurbo is a gas turbine engine simulation platform, not a dedicated valve CFD tool. After CFD establishes valve characteristics (Cv curves, response times, pressure drop relationships), those results are ready for system-level work.
Engineers can then load the valve models into SimTurbo’s component-based gas turbine control simulations and validate real-time performance.
Workflow integration:
- Perform detailed valve CFD to extract flow coefficients, pressure drop maps, and actuator torque across travel positions
- Tabulate valve characteristics as functions of position and pressure ratio
- Integrate valve maps into SimTurbo's component-based gas turbine model
- Simulate transient scenarios: engine startup, shutdown, throttle changes, load variations
- Validate control valve performance within complete engine operating scenarios
Benefits of this approach:
- Test transient valve behavior during real engine events
- Evaluate how valve characteristics affect fuel control, bleed air systems, and variable geometry actuation
- Support hardware-in-the-loop (HIL) testing preparation with validated valve models
- Enable virtual prototyping of control systems before expensive physical integration
- Optimize control logic based on actual valve response and engine dynamics
SimTurbo’s real-time Windows-based environment lets engineers observe control-loop interactions, PID responses, and system stability. Those dynamics show up as valve commands change during simulated flight profiles or power-generation load cycles.
Conclusion
CFD valve simulation lets engineers predict performance, catch problems, and refine designs before manufacturing. With mesh independence studies, the right turbulence models, and validation against experimental or standard test data, CFD typically reaches 2–6% accuracy for pressure drop and flow coefficients.
Treat valve simulation as an iterative process. Early results guide mesh refinement, physics model selection, and geometry changes. Final checks against test data or published benchmarks confirm model fidelity and support confident design decisions.
Cloud platforms and simpler interfaces have lowered the barrier to CFD tools. Advantage now comes from engineering judgment:
- Which turbulence model fits the flow regime
- Where to refine the mesh
- How to set boundary conditions that match real tests
- When to fold valve maps into broader system analysis
Pairing detailed valve CFD with system-level simulation—for example, bringing valve characteristics into tools like SimTurbo—shows how a valve behaves in real operating environments.
Frequently Asked Questions
Which software is best for CFD valve simulation?
The best choice depends on requirements, budget, and expertise. Ansys Fluent and CFX have the strongest peer-reviewed valve validation evidence. Cloud tools like SimScale cut hardware needs, while OpenFOAM offers flexibility with more setup effort.
What are the 7 types of valves commonly analyzed with CFD?
Common types are globe, ball, butterfly, gate, check, control, and plug valves. Each brings distinct CFD challenges—seat-jet resolution for globe valves, separated-flow modeling for ball valves, torque and wake analysis for butterfly valves, and transient fluid-structure interaction for check valves.
What is the Cv or Kv flow coefficient and why does it matter?
Cv (US) and Kv (metric) measure valve flow capacity under standard pressure-drop conditions—gpm at 1 psi for Cv, m³/h at 1 bar for Kv. They drive sizing, system design, and cross-manufacturer comparisons. CFD is validated when it predicts the same coefficient at the same travel and standard conditions.
How accurate is CFD simulation compared to physical valve testing?
Well-executed CFD typically lands within 0.5%–6% of test data for pressure drop and flow coefficients. Recent studies report differences under 6% for solenoid valves and under 5% for ball-check valves. Accuracy hinges on mesh quality, turbulence models, boundary conditions, and whether load-induced geometry change is modeled.
What are the most common mistakes in valve CFD simulation?
Common mistakes include short inlet/outlet pipes, coarse mesh near the seat, habit-based turbulence models, skipped cavitation modeling, and no validation against tests. Ignoring diaphragm or trim deformation can also miss 20%+ changes in flow capacity under load.
Can CFD simulation predict valve cavitation and erosion?
CFD can predict cavitation inception, vapor regions, and cavitation indices with multiphase models such as Zwart-Gerber-Belamri. Erosion prediction needs extra modeling of bubble collapse and material response—vapor volume fraction alone is not enough—and should be calibrated against mass-loss experiments.