Introduction
Gas turbine engines in aircraft and power plants depend on one hard constraint: compressor-turbine matching. The turbine must extract just enough energy from hot combustion gases to drive the compressor so the engine stays stable and efficient across the operating envelope.
When matching fails, the result can be compressor surge, efficiency loss, or full engine instability. Engineers have to balance pressure ratios, temperature limits, and component efficiencies without eroding surge margin.
Poor matching can drive compressor stall, power loss, severe pressure transients, and even flameout—failure modes no design team can treat as edge cases.
This guide covers the fundamentals, key parameters, matching procedures, and governing equations engineers use in practice. It also covers troubleshooting tactics and how real-time simulation shortens validation before costly prototype testing.
Key Takeaways
- Matching requires turbine power to equal compressor demand at every steady-state point
- Key parameters: CPR, turbine expansion ratio, temperatures, and polytropic efficiencies
- Performance maps bound the envelope by surge, choke, speed, and material limits
- Off-design analysis validates matching across altitude, throttle, and ambient changes
- SimTurbo speeds matching studies with real-time maps and validated physics models
Understanding Compressor-Turbine Matching Fundamentals
What Compressor-Turbine Matching Means
Compressor-turbine matching is the engineering discipline that selects operating points where both components satisfy flow continuity and shaft work balance simultaneously. NASA states the core constraint directly: "the work done by the turbine must equal the work required by the compressor," since both share the same rotating shaft.
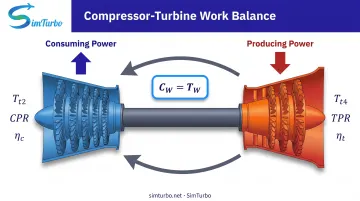
The compressor consumes mechanical power to raise air pressure, while the turbine extracts thermal energy from hot gases to produce shaft power. Because they're mechanically coupled, any mismatch creates torque imbalance—either the compressor can't sustain its pressure ratio (leading to surge), or the turbine over-powers the system (causing excessive stress and inefficiency).
Engineers distinguish between:
- Design-point matching: Optimizing geometry and operating parameters for one primary condition (e.g., cruise thrust at 35,000 ft)
- Off-design matching: Holding acceptable performance across other speeds, altitudes, and throttle settings
The Work Balance Equation
The fundamental matching relationship starts with power equality. NASA publishes the governing equations:
Compressor specific work: CW = cp × Tt2 × (CPR^((γ-1)/γ) - 1) / ηc
Turbine specific work: TW = ηt × cp × Tt4 × (1 - TPR^((γ-1)/γ))
Matching condition: CW = TW
This yields the turbine pressure ratio required to drive a given compressor:
TPR^((γ-1)/γ) = 1 - Tt2 × (CPR^((γ-1)/γ) - 1) / (ηc × ηt × Tt4)
Where:
- cp = specific heat at constant pressure
- γ = ratio of specific heats (typically ~1.4 for air, ~1.33 for combustion products)
- Tt2 = compressor inlet total temperature
- Tt4 = turbine inlet total temperature
- ηc, ηt = compressor and turbine polytropic efficiencies
- CPR = compressor pressure ratio (P03/P02)
- TPR = turbine pressure ratio (P05/P04, less than 1 for an expanding turbine per NASA convention)
Higher turbine inlet temperature (Tt4) reduces the expansion ratio required. Poor component efficiencies do the opposite: the turbine must extract more work to deliver the same compressor power.
Why Components Must Be Carefully Matched
Mismatch consequences fall into three categories:
- Insufficient turbine power: Starves the compressor, drops achievable pressure ratio, and pushes the operating point toward surge. NASA research links surge to power loss, large inlet/nacelle pressure transients, and possible combustor flameout.
- Excessive turbine extraction: Over-speeds the compressor, raises mechanical stress, and drives operation toward choke limits where efficiency falls off.
- Efficiency degradation over time: Fouling, erosion, and tip-clearance growth shift component maps. A match that is clean at delivery can drift toward instability after thousands of hours if margins were never built in.
Key Parameters and Variables in Matching Analysis
Pressure Ratios and Their Significance
Compressor Pressure Ratio (CPR) measures how much the compressor raises total pressure: CPR = P03/P02. Higher CPR delivers more thermodynamic work per cycle but demands correspondingly more shaft power.
Turbine Pressure Ratio (TPR) quantifies expansion across the turbine: TPR = P05/P04. Under the NASA convention, TPR is less than one because the turbine expands the gas. Lower values mean deeper expansion and more work extraction.
These ratios are thermodynamically linked through the matching equation. Real-world examples span a wide range:
- The GE9X turbofan achieves a 60:1 overall pressure ratio and a 27:1 core compressor ratio
- Siemens SGT-800 industrial gas turbines operate between 18.3:1 and 22.0:1 depending on rating
- Research compressor stages, such as NASA's rotorcraft centrifugal unit, measured 4.68:1 in component testing
Chosen pressure ratios set the work each component must exchange on the shaft—and whether a stable map match exists at the target speed and flow.
Temperature Ratios and Thermal Limits
Inlet total temperature (Tt2) and turbine inlet temperature (Tt4) set how much compressor work is required and how much turbine work is available:
- Tt2 typically ranges from ~216 K at cruise altitude to ~300 K+ on a hot desert runway; compressor work scales directly with Tt2
- Tt4 is capped by materials and cooling—NASA documents environments above 2000 K—and higher Tt4 yields more shaft work per unit of expansion
- Matching must hold maximum Tt4 limits through thermal transients in throttle bursts and altitude changes
Those temperature bounds feed the same work-balance equation as the efficiency terms below.
Component Efficiencies
Compressor polytropic efficiency (ηc) captures how closely the real compression process approaches the ideal isentropic path. NASA's rotorcraft compressor stage measured 85.5% polytropic efficiency, slightly below pre-test predictions.
Turbine efficiency (ηt) measures energy extraction effectiveness. Achieved values depend on stage design, cooling flows, and Reynolds number effects.
Mechanical efficiency accounts for bearing friction and windage losses. NASA matching equations often emphasize compressor and turbine efficiencies, yet real shafts still lose about 1–2% of power to mechanical inefficiencies.
Efficiency degradation over thousands of operating hours—from fouling, erosion, and tip-clearance growth—requires conservative matching margins to maintain operability throughout the engine's service life.
Mass Flow Rate Considerations
Flow continuity demands that mass flow entering the compressor (plus fuel added in the combustor) exits through the turbine and nozzle. Engineers use corrected mass flow parameters to normalize performance across varying inlet conditions:
Corrected flow = ṁ × √(Tt) / Pt
Both compressor and turbine maps plot corrected flow against pressure ratio at constant corrected speed lines. Matching means finding compatible flow points on both maps that also satisfy work balance—a coupled, iterative problem usually solved in performance simulation software such as SimTurbo.
Step-by-Step Matching Procedure for Engineers
Step 1: Define Design Requirements and Operating Points
Establish the primary operating condition where peak efficiency matters most (cruise for aircraft, base load for power generation). NASA identifies design variables including:
- Thrust or shaft power requirement
- Altitude and flight speed (or site conditions for stationary engines)
- Maximum turbine temperature limit
- Desired compressor pressure ratio
- Nozzle configuration
Document all anticipated scenarios: takeoff, climb, idle, altitude variation, hot-day operation, and degraded-component conditions. This operating envelope determines how robust your matching solution must be.
Step 2: Select or Design Compressor Configuration
Choose compressor type (centrifugal for pressure ratios up to ~8-10:1, axial for higher ratios) and calculate required work:
CW = cp × Tt2 × (CPR^((γ-1)/γ) - 1) / ηc
Determine design speed considering:
- Rotordynamic critical speeds
- Blade tip-speed limits (typically Mach 1.3-1.5 for axial compressors)
- Aerodynamic efficiency sweet spots
Size rotor diameter and blade geometry to achieve target CPR at design corrected flow. Generate or obtain a compressor performance map covering the full anticipated operating range.
Step 3: Determine Turbine Requirements
Calculate required turbine work from the compressor power demand, then solve for turbine pressure ratio:
TPR^((γ-1)/γ) = 1 - Tt2 × (CPR^((γ-1)/γ) - 1) / (ηc × ηt × Tt4)
Select turbine type (axial for most applications, radial-inflow for small engines) and stage count. Design blade angles, mean radius, and annulus area to achieve the calculated TPR at the mechanically coupled shaft speed.
The turbine must handle the same corrected flow as the compressor (accounting for fuel addition and cooling bleeds), creating a second constraint that must be satisfied simultaneously with the work balance.
Step 4: Construct Performance Maps
Generate component maps relating corrected flow, pressure ratio, efficiency, and corrected speed. NASA's T-MATS methodology uses these maps as the foundation for both design-point fitting and off-design solution.
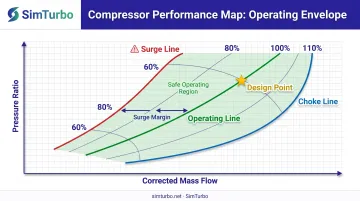
Plot the operating line (also called the running line or equilibrium line). It is the locus of steady-state points where compressor and turbine work balance, flow is compatible, and pressure relationships close. Verify that line stays far enough from the compressor surge boundary across all speeds.
NASA's rotorcraft compressor research measured 7.5% stall margin at the design point, below predictions. That gap is why you validate margin assumptions instead of trusting estimates alone.
Step 5: Validate Design Through Simulation
Use thermodynamic cycle simulation to model the coupled system across the full operating envelope. Modern platforms apply Newton-Raphson iteration to converge flow, pressure, temperature, and shaft-speed balances at each operating point.
Run cases covering:
- Full throttle range from idle to maximum power
- Altitude variations
- Hot-day and cold-day ambient conditions
- Transient maneuvers (slam acceleration, deceleration, afterburner engagement)
Check for instabilities, temperature excursions, or surge-margin erosion. Iterate component geometry, map scaling, or control logic if deficiencies emerge.
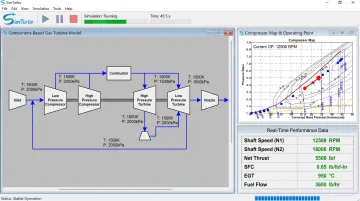
SimTurbo supports this step with component-based modeling and real-time visualization of compressor and turbine maps during transient runs. Its J85-GE-21 single-spool turbojet simulation was validated against NASA test data, with reported accuracy within ±2% for thrust, flow rate, temperature, and thrust-specific fuel consumption.
Step 6: Account for Degradation and Margins
Real engines degrade over time. Fouling reduces compressor efficiency and flow capacity; turbine erosion and tip-clearance growth reduce turbine efficiency and alter expansion characteristics. Conservative matching includes:
- Power margin to accommodate efficiency loss
- Surge-margin buffer to maintain stability as compressor maps shift
- Temperature margin to avoid exceeding material limits during transients
ASME PTC 22-2023 governs thermal performance testing for gas turbines, providing standardized methods to measure corrected power, heat rate, and exhaust conditions during acceptance testing.
Operating Envelopes and Performance Maps
The operating envelope defines the region on a compressor or turbine performance map covering all achievable steady-state points. Boundaries include:
- Surge line (left): Low-flow instability limit where flow separation triggers compressor stall
- Choke line (right): Maximum flow capacity where sonic conditions block further increases
- Maximum speed line (top): Mechanical or aerodynamic limit on rotational speed
- Minimum speed/power (bottom): Idle or windmilling limit at the low end of useful operation
The matching line traces equilibrium operating points as throttle, altitude, or ambient temperature change. At each point along this line, compressor work equals turbine work, mass flows stay compatible, and the pressure balance closes.
Off-design operation moves the engine along the matching line. A throttle increase raises turbine temperature (Tt4), so the turbine extracts more work and drives the compressor to higher CPR and corrected speed. Proper matching keeps that trajectory inside safe margins across the full flight or load envelope.
Common Challenges and Troubleshooting in Matching
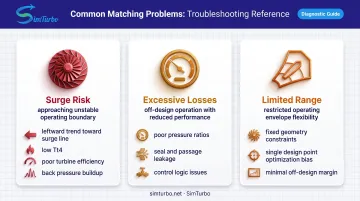
Surge and Instability
Surge and instability issues arise when the operating line moves too close to the surge boundary. Causes include:
- Insufficient turbine power extraction (often from low Tt4 or poor turbine efficiency)
- Excessive back pressure downstream
- Inlet flow distortion reducing effective surge margin
Practical fixes include:
- Adjust turbine nozzle area to increase expansion ratio
- Add variable compressor geometry (variable stators or bleed valves)
- Redesign blade geometry to shift the surge line left
Excessive Fuel Consumption
Excessive fuel consumption usually means the match is off the efficiency peaks, or pressure losses between components are too high.
Compare actual operating points to the efficiency islands on component maps. Then re-optimize pressure ratios, tighten sealing to cut leakage, or retune the control system so the engine holds better operating points.
Limited Operating Range
Limited operating range is a built-in trade-off. Peak efficiency sits at one narrow design point, yet real engines need acceptable performance well away from that sweet spot.
Variable geometry (adjustable stators, variable turbine nozzles) can widen the useful range by reshaping component maps in service. ASME research also shows that back-pressure changes alter instability regimes, so surge behavior is not uniform across the map.
Component-level mismatch shows up the same way inside a stage. NASA rotorcraft compressor testing tied efficiency loss partly to corrected-flow mismatch between the impeller and diffuser, which produced adverse incidence and possible flow separation. The fix was to increase diffuser flow capacity and improve vane incidence angles.
Modern Tools and Simulation Approaches
Thermodynamic Cycle Analysis Software
Modern simulation platforms model coupled compressor-turbine systems using first-principles thermodynamics and empirical component maps. NASA's T-MATS (Toolbox for the Modeling and Analysis of Thermodynamic Systems) exemplifies this approach:
- Compressor and turbine blocks relate corrected flow, pressure ratio, efficiency, and corrected speed through validated maps
- Design-point routines calculate map scale factors and nozzle throat areas to match a known reference condition
- Off-design solvers apply Jacobian-based Newton-Raphson iteration to converge all component balances at each time step
One T-MATS validation compared its model against NASA's NPSS reference with reported differences within 0.5% for steady-state quantities and 0.15% thrust error.
Real-Time Simulation and Validation
SimTurbo provides a Windows-based, component-oriented environment for real-time gas turbine simulation. Engineers configure turbojet, turbofan, and advanced-cycle architectures by dragging and dropping components (compressors, turbines, combustors, shafts, nozzles, recuperators, afterburners), then connecting them graphically.
Key capabilities for matching analysis:
- Interactive compressor and turbine maps displaying corrected flow, pressure ratio, and operating points
- Real-time transient simulation showing how operating points move during throttle bursts, startup, or altitude changes
- Performance data tables including altitude, Mach number, component efficiencies, and power metrics
- Built-in PID controllers, limiters, actuators, and sensors for control-system validation
SimTurbo's J85-GE-21 simulation validated against NASA Lewis Research Center test data, achieving accuracy within ±2% for thrust, flow rate, temperature, and TSFC.
Universities also use it to teach matching principles. Students build single- or dual-spool engine models, adjust parameters, and watch compressor surge margin respond in real time as control logic handles transients.
In one documented case, surge margin dropped from a normal 20–25% to below 5% during an afterburner transient. Adaptive fuel-flow and nozzle-area logic restored stability—the kind of dynamic interaction engineers need to validate before hardware testing.
Benefits of Simulation-Driven Matching
Simulation-driven matching pays off in three practical ways:
- Cost and time: Catch inadequate surge margin, temperature excursions, and flow mismatches before rig tests or prototypes. Parametric pressure-ratio and efficiency studies finish in hours, not months.
- Understanding: Real-time views show how the compressor operating point tracks toward surge in a slam acceleration, then recovers as fuel flow is modulated—intuition static maps rarely build.
- Iteration speed: Add an intercooler, swap a turbine stage, or change nozzle geometry and immediately see effects on matching, efficiency, and operability. That speed opens configurations teams might otherwise skip.
Frequently Asked Questions
What is the difference between a compressor and a turbine?
A compressor uses shaft power to raise air pressure through rotating blades. A turbine expands high-pressure, high-temperature gas through blade rows and converts that energy into shaft power that drives the compressor.
Why is compressor-turbine matching critical in gas turbine design?
Poor matching causes instability, lower efficiency, and possible mechanical failure. If the turbine under-delivers power, the compressor can surge; if it over-extracts, stress and losses rise. Correct matching keeps shaft work balanced across the operating range.
What are the key parameters that must be balanced in compressor-turbine matching?
Engineers balance compressor pressure ratio (CPR), turbine expansion ratio (TPR), compressor inlet temperature (Tt2), turbine inlet temperature (Tt4), compressor polytropic efficiency (ηc), turbine efficiency (ηt), mechanical losses, and corrected mass flow rates. These variables interact through the fundamental work-balance equation to define achievable operating points.
How do you calculate the work balance between the compressor and turbine?
Compressor work: CW = cp × Tt2 × (CPR^((γ-1)/γ) - 1) / ηc. Turbine work: TW = ηt × cp × Tt4 × (1 - TPR^((γ-1)/γ)). Set CW = TW and solve for the turbine pressure ratio that drives the compressor at the chosen condition.
What software tools can help with compressor-turbine matching analysis?
Thermodynamic cycle tools model coupled compressor-turbine systems with component maps and physics-based solvers. SimTurbo provides a Windows environment with drag-and-drop components, real-time map visualization, transient simulation, and control integration. Its J85-GE-21 model was validated against NASA test data within ±2%.
What are common mistakes in compressor-turbine matching?
Common mistakes include:
- Optimizing only the design point and ignoring off-design operation
- Underestimating component degradation over time
- Skipping surge-margin checks across the full envelope
- Ignoring inlet flow distortion
- Accepting simulation results without map-domain or hardware validation