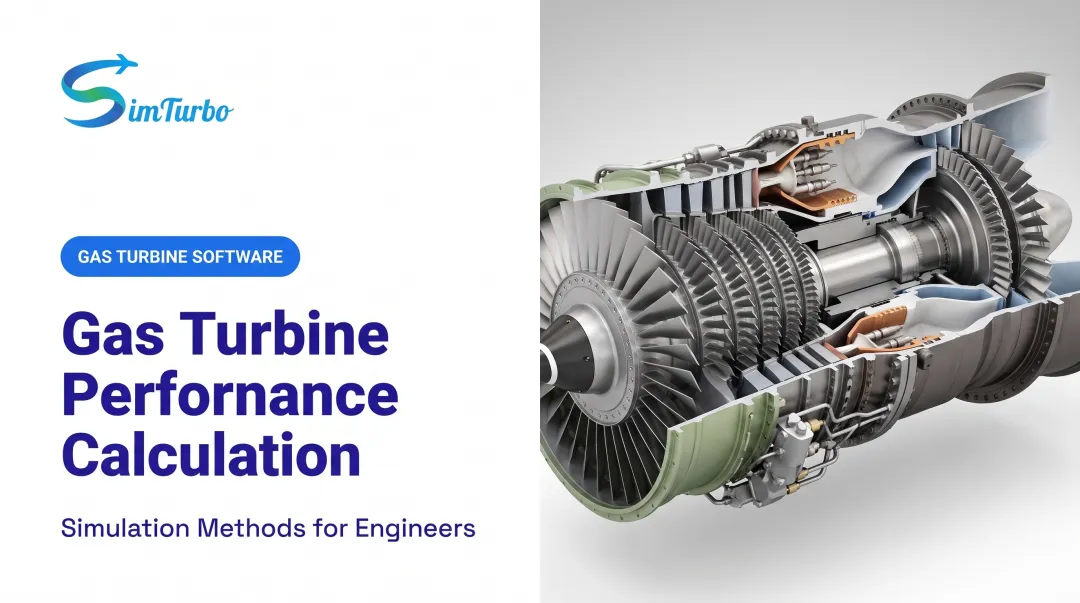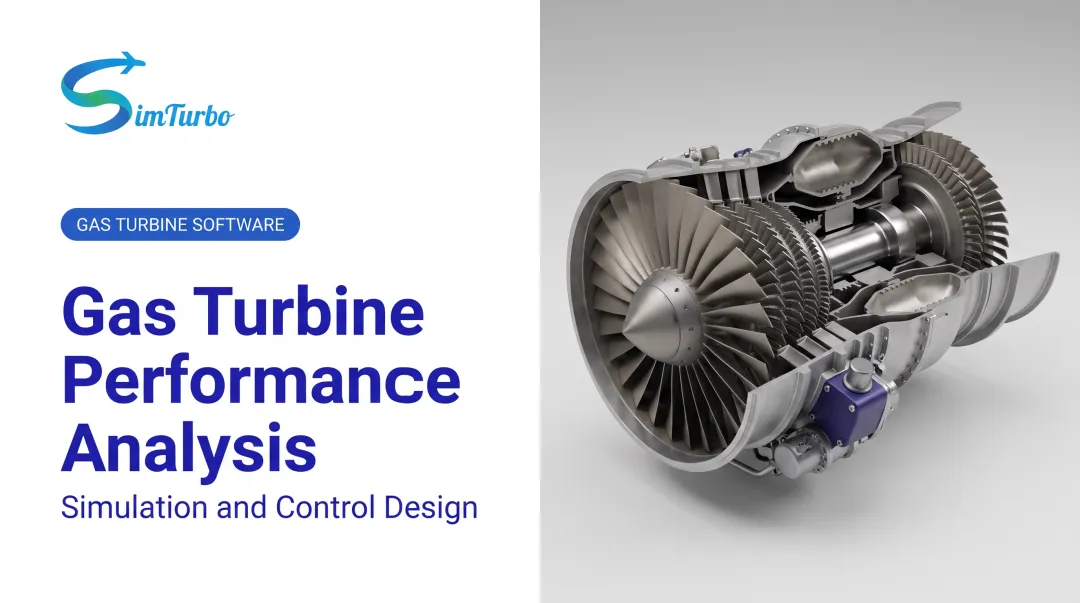
Engineers who ignore what the curve actually represents often misapply engines to the wrong site conditions or run components past their safe margins. That's an expensive mistake to make after hardware is already installed.
This article breaks down what the performance curve represents, its operating range, its key technical properties, how it's measured and validated, and what happens when engines run outside its boundaries.
TL;DR
- The performance curve plots power, efficiency, and mass flow against speed, ambient temperature, altitude, and load
- ISO reference conditions govern the baseline curve, which shifts with temperature, pressure, and humidity
- Compressor-turbine matching, surge margin, and firing temperature limits define the curve's boundaries
- Validated simulation tools can predict curve behavior within a few percent of test data
What the Gas Turbine Performance Curve Represents
Technically, the performance curve is the plotted relationship between output parameters (power, thrust, efficiency, exhaust temperature) and operating variables (RPM, ambient temperature, altitude, fuel flow). GE's own gas turbine performance documentation illustrates this by relating ambient temperature to output, heat rate, heat consumption, and exhaust flow for its MS7001 unit line.
The curve serves two purposes at once:
- Design reference — used to set rated conditions when an engine is first specified
- Operational tool — used to predict off-design behavior once the engine is in service
The curve isn't a fixed datasheet value. It's a derived characteristic built from thermodynamic cycle analysis and component matching. Compressor and turbine maps, corrected flow calculations, and shaft-balance equations all feed into it.
Factors That Influence the Curve in Real-World Operation
Field performance rarely matches the idealized ISO-reference curve exactly. Several factors pull the real-world curve away from the published one.
- Ambient conditions — Lower inlet temperature improves output and heat rate; higher elevation cuts air density and output. A 2021 review found power drops up to 22% and ~0.06% thermal-efficiency loss per °C above ISO.
- Manufacturing tolerances — Efficiency varies unit to unit; a NASA small-compressor program measured 77% peak efficiency vs. 84.2% after Reynolds and clearance corrections, partly from blade spacing and surface finish.
- Load profile and duty cycle — Steady-state operation behaves differently than transient, cyclic loading.
- Fouling and erosion — A 2014 ASME paper reported 5–7% shaft-power loss in the first 10,000 hours from compressor fouling; washing recovered about 30% of that loss.
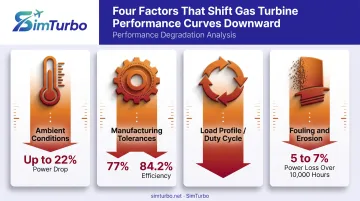
Over time, these effects compound and shift the curve downward, sometimes permanently.
Operating Range of the Performance Curve
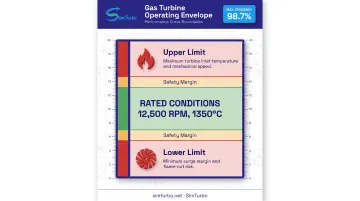
The curve's shape isn't arbitrary. It's bounded by design limits, component maps, and safety margins set in the engineering phase.
Published curves assume ISO standard reference conditions. ISO 2314 specifies 15°C, 101.325 kPa absolute, and 60% relative humidity as the standard intake reference point. Any published curve holds true only under these assumptions, plus a specified fuel type, altitude, and load profile. Change any one of those and the curve needs correction.
Two boundaries cap the usable range:
- Upper limit — set by maximum turbine inlet temperature and mechanical speed. NASA states plainly that exceeding the material-set maximum burner-exit temperature damages the burner and turbine.
- Lower limit — set by minimum surge margin and flame-out risk on the compressor side.
Rated conditions and absolute limits aren't the same thing. The gap between them exists for a reason: thermal stress, surge risk, and stall margin all need buffer room. NASA identifies maximizing surge margin while meeting design-point performance as a core design objective.
Running an engine near the edge of that margin isn't free. It shortens part life and raises the odds of an instability event, even if nothing fails immediately.
Key Technical Properties of the Performance Curve
Three properties define how the curve behaves and how it responds to load, ambient conditions, and component aging.
Property 1: Stability and Variability
The curve shifts under changing load, ambient conditions, and time in service. Aging engines drift from their original as-tested curve, which is why repeatability across test runs matters for long-term performance tracking.
Property 2: Compressor-Turbine Matching
NASA describes the components as coupled through the main shaft: turbine work must equal compressor work at every operating point. Compressor pressure ratio and turbine pressure ratio are solved as coupled quantities, using component efficiencies and inlet temperatures together, not in isolation.
SimTurbo's matching interface displays compressor and turbine maps side by side. It plots corrected mass flow and pressure ratio with live operating points, so engineers can watch how a change on one shaft component ripples through the other.
Property 3: Coupling with Ambient Corrections
Corrected parameters (corrected flow and corrected speed) normalize curves so they can be compared across different ambient conditions. NASA defines corrected weight flow using nondimensional total-temperature and total-pressure ratios.
Shifting the curve for more power often costs exhaust temperature margin. For example, on GE's MS7001EA, a 4-inch H2O inlet pressure drop produced a 1.42% output loss, a 0.45% heat-rate increase, and a 1.9°F exhaust-temperature increase. Every gain on one axis of the curve usually shows up as a penalty on another.
How Performance Curves Are Specified, Measured, and Validated
The curve is both a published design spec and a field-verifiable check, and the distinction matters when someone hands you a datasheet and calls it gospel.
Specification and Documentation
- ISO 3977-2 defines standard reference conditions and ISO standard ratings for procurement
- ASME PTC 22 governs open-cycle thermal-performance testing for corrected power, heat rate, exhaust flow, and exhaust temperature
- Rated (guaranteed) curves differ from tested (measured) curves — the first is a promise, the second is proof
Measurement and Verification Methods
ISO 2314's test boundary lists the full instrumentation set:
- Ambient temperature, pressure, and humidity
- Compressor inlet and outlet temperature/pressure
- Fuel flow and properties
- Turbine and stack exhaust conditions
- Electrical output and shaft torque/speed
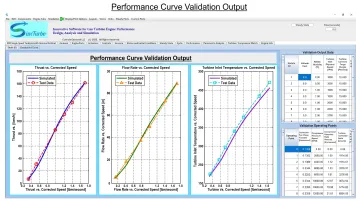
Simulation platforms have closed much of the gap between waiting for a physical test stand and getting usable curve data. SimTurbo, built by Controls Research LLC, generates and validates compressor and turbine performance curves in real time from component maps, real-gas effects, and pressure-loss models.
Its J85-GE-21 single-spool turbojet validation against NASA Lewis Research Center test data landed within ±2% across thrust, flow rate, temperature, and thrust-specific fuel consumption.
That said, a lab or test-stand curve isn't automatically your field curve. GE's LM6000 rating explicitly builds in inlet and exhaust losses but excludes balance-of-plant equipment, and warns that actual performance varies with project, fuel, and site ambient conditions.
Implications of Operating Outside the Curve's Range
Operating outside the curve's range rarely fails an engine on the spot. Damage builds later through a slow chain of downstream problems.
Performance loss mechanisms:
- Reduced mass flow from hot or high-altitude inlet conditions
- Lower pressure ratio as components drift from design point
- Higher exhaust temperature as the engine compensates for lost margin
Accelerated wear and damage:
- Compressor surge can damage thrust bearings and seals, eventually overheating the compressor
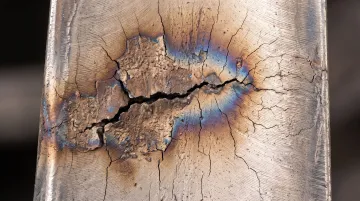
- Hot-gas-path swings of up to 140°C (252°F) occur even in steady operation and drive coating fatigue and cracking
Common Misinterpretations
- Treating the ISO curve as a guarantee rather than a reference that needs site correction for temperature, pressure, and humidity
- Ignoring compressor-turbine interaction when reading an isolated segment of the curve — the two components are coupled, not independent
- Applying lab-derived curves directly to field conditions without correcting for installation losses and site-specific ambient conditions
Frequently Asked Questions
What are the common causes of turbine engine performance loss?
Ambient temperature rise, compressor fouling, blade erosion, and general component degradation are the leading causes. Each one shifts the performance curve downward over time.
How does mass flow affect the performance of a gas turbine engine?
Mass flow drives power output directly. Denser, colder air increases mass flow and power; hot or humid air reduces both.
How is gas turbine efficiency determined?
Efficiency equals net power output divided by fuel energy input, based on the fuel's lower heating value, and is read from the thermal efficiency curve at the operating point.
How is compressor efficiency calculated?
Compressor efficiency is the ratio of ideal (isentropic) to actual temperature rise across the compressor, typically read from a compressor map at the operating point.
What is the typical pressure ratio for a jet engine?
Pressure ratios vary widely by engine class. Older turbojets often ran in the single digits to low double digits, while modern high-bypass turbofans like the GE9X reach roughly 60:1 overall, with a 27:1 core-compressor ratio.
At what stage in a turbine engine are gas pressures greatest?
Peak total pressure occurs at the compressor discharge, right at the combustor inlet, just before pressure begins dropping through combustion and expansion.