Introduction
Every time a commercial airliner climbs to cruise altitude or a marine gas turbine powers a naval vessel, a fundamental pressure transformation takes place inside the engine's turbine section.
The turbine pressure ratio—how much pressure drops as hot gas expands through the stages—directly affects thrust, thermal efficiency, fuel burn, and surge margin.
Yet turbine pressure ratio (TPR) is only one of several critical pressure measurements in gas turbine systems. Engineers also track overall pressure ratio (OPR), compressor pressure ratio (CPR), and engine pressure ratio (EPR), each serving distinct design and control purposes.
Knowing what each metric measures, how they interact, and when to use which ratio helps aerospace, marine, and power-generation engineers optimize performance.
This article explains what turbine pressure ratio means, how it differs from related pressure metrics, its impact on cycle efficiency and component matching, and how simulation tools enable virtual prototyping of pressure-ratio configurations before physical testing.
Key Takeaways
- Turbine pressure ratio (TPR) measures pressure drop across turbine stages and is always less than 1.0
- Higher overall pressure ratios raise thermal efficiency but also compressor discharge temperatures
- Commercial turbofans reach OPRs of 40:1–60:1; military engines typically run 20:1–30:1
- Engineers use pressure-ratio data to prevent surge, validate controls, and match mission profiles
- Simulation platforms enable real-time pressure-ratio analysis and virtual validation before hardware tests
Understanding Turbine Pressure Ratio: Definition and Fundamentals
Turbine pressure ratio (TPR) is the ratio of turbine exit total pressure to turbine inlet total pressure, expressed as pt5/pt4. According to NASA Glenn Research Center, TPR is always less than or equal to 1.0 because pressure decreases as the gas expands and performs work on the turbine blades.
Thermodynamic Principle
As hot, high-pressure gas flows through turbine stages, it expands against the blades, spinning the turbine shaft and driving the compressor. This energy extraction comes at the cost of reduced total pressure and total temperature. NASA defines the work output per unit mass as:
TW = cp(Tt4 - Tt5)
where cp is specific heat at constant pressure, and Tt4 and Tt5 are total temperatures at turbine inlet and exit.
Isentropic Process and Efficiency
For an ideal isentropic (no friction, no heat loss) turbine, the temperature ratio relates to pressure ratio by:
Tt5/Tt4 = (pt5/pt4)^((γ-1)/γ)
where γ is the ratio of specific heats. Real turbines fall short of 100% isentropic efficiency, so for a given pressure ratio the actual temperature drop is smaller and exit temperature runs higher than the ideal case.
Station Numbering Convention
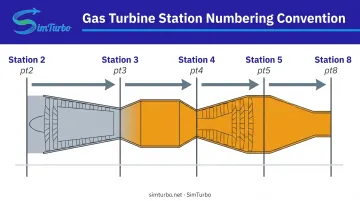
Industry uses standardized station numbers to define measurement locations:
- Station 2: Compressor inlet
- Station 3: Compressor exit (combustor inlet)
- Station 4: Turbine inlet (combustor exit)
- Station 5: Turbine exit
- Station 8: Nozzle throat/tailpipe exit
This convention ensures consistency across manufacturers, simulation tools, and research publications. When engineers refer to "pt4" or "pt5," they're using these reference points.
Types of Pressure Ratios in Gas Turbines
Gas turbine performance involves multiple pressure ratios, each describing a different portion of the thermodynamic cycle. Confusing them leads to design errors and miscommunication.
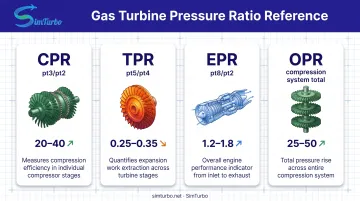
Compressor Pressure Ratio (CPR)
CPR = pt3/pt2—the ratio of compressor exit to inlet total pressure. CPR is always greater than 1.0 because compressors add energy to the flow, raising both pressure and temperature. High-bypass turbofans span a wide range: older designs sit near 18:1, while advanced engines exceed 40:1.
Turbine Pressure Ratio (TPR)
TPR = pt5/pt4—the ratio of turbine exit to inlet total pressure. TPR is always less than 1.0 because turbines extract energy. The magnitude of TPR depends on how much work the turbine must produce to drive the compressor and accessories.
Overall Pressure Ratio (OPR)
OPR refers to the complete compression system's pressure rise, typically reported by manufacturers as a single number. For example, the CFM LEAP-1A achieves an OPR of 40:1, and the GE GEnx-1B reaches 43.8–47.4:1 at takeoff. OPR is the cumulative rise across all compressor stages and the main benchmark for thermal-efficiency potential.
Engine Pressure Ratio (EPR)
EPR = pt8/pt2—the ratio of nozzle exit (or tailpipe) total pressure to engine inlet total pressure. NASA defines EPR as the product of all component pressure ratios:
EPR = CPR × (burner PR) × TPR × (nozzle PR)
EPR can be less than 1.0 at low power settings because pressure losses in the combustor and nozzle can outweigh the compressor's pressure rise. EPR is measurable on an operating engine and is often displayed to pilots as a thrust indicator.
Pressure Ratio Comparison
| Ratio | Definition | Typical Value | Use Case |
|---|---|---|---|
| CPR | pt3/pt2 | 18:1 to 40:1+ | Compression system design |
| TPR | pt5/pt4 | <1.0 | Turbine work extraction, shaft-power calculation |
| EPR | pt8/pt2 | <1.0 at idle, >1.0 at high power | Real-time thrust control, pilot display |
| OPR | Manufacturer-reported compression ratio | 40:1 to 60:1 (modern commercial) | Cycle efficiency benchmarking |
Performance Implications of Pressure Ratios
Thermal Efficiency and the Brayton Cycle
According to MIT's thermodynamics course material, the ideal Brayton cycle efficiency is:
η = 1 - 1/PR^((γ-1)/γ)
where PR is the cycle pressure ratio (equivalent to OPR in a simple cycle). Higher pressure ratios raise thermal efficiency, but the gains are nonlinear. Each extra increment of OPR returns less benefit as the ratio climbs.
The National Academies reported in 2016 that commercial aircraft engine thermodynamic efficiency improved from approximately 30% to more than 50% over 50 years, driven largely by higher OPRs along with better materials and cooling.
Trade-Offs of Higher Pressure Ratios
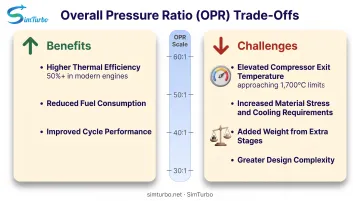
Those efficiency gains come with real design costs. Higher OPR pushes compressor exit temperature, materials, cooling, and weight in ways that limit how far you can go.
Compressor Exit Temperature
NASA's compressor thermodynamics equations show that ideal compression temperature rise is:
Tt3/Tt2 = (pt3/pt2)^((γ-1)/γ)
When OPR climbs from 30:1 to 50:1, compressor discharge temperature rises sharply and moves closer to material limits.
Material and Cooling Challenges
Han's 2018 ASME review reports that advanced gas turbines run rotor inlet temperatures around 1,700°C, while blade material yield temperatures sit near 1,200°C. Film cooling, thermal barrier coatings, and internal air channels close that gap, but they add weight, cost, and design complexity.
Weight and Complexity
Higher pressure ratios need more compressor stages, heavier casings for higher stresses, and more elaborate cooling. In weight-critical applications, those penalties can erase a large share of the efficiency gain.
Design Trade-offs and Optimization
OPR is never set in isolation. Material limits, mission profile, and durability targets pull the cycle design in different directions.
Material Limitations
The maximum achievable OPR is constrained by the temperature at the last compressor stage and the first turbine stage. Even with advanced nickel-based superalloys and ceramic thermal barrier coatings, today's engines operate near the thermal limits of their materials.
Pushing OPR higher demands better cooling strategies or breakthroughs in high-temperature materials.
Application-Specific Optimization
Commercial Turbofans: High OPR for Cruise Efficiency
Airlines prioritize fuel burn and operating cost. Modern commercial engines such as the LEAP-1A (40:1 OPR) and GEnx-2B (44.7:1 OPR at takeoff) target sustained high-altitude cruise. There, thermal efficiency cuts fuel consumption directly.
Military Engines: Moderate OPR for Operational Flexibility
Fighter engines must handle extreme throttle transients, sustained afterburner operation, and high-G maneuvers. The GE F110 reaches 30.7:1 at maximum power; the F414 runs at 30:1. Those ratios sit below commercial engines but still meet mission needs while holding up under harsh conditions.
Historical Evolution
| Era / Application | Engine | Reported Pressure Ratio | Source |
|---|---|---|---|
| Early turbojet | Junkers Jumo 004 | Compression ratio 3.1:1 | Deutsches Museum |
| Military turbofan | GE F110 | 30.7:1 at maximum power | MTU |
| Military turbofan | GE F414 | 30:1 | GE Aerospace |
| Commercial turbofan | CFM LEAP-1A/-1B | OPR 40:1 / 41:1 | MTU |
| Commercial turbofan | GE GEnx-1B/-2B | OPR 43.8–47.4:1 / 44.7:1 (takeoff) | MTU |
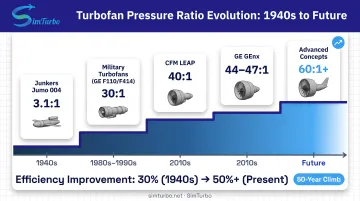
From the Jumo 004’s 3.1:1 compression ratio to commercial OPRs above 40:1, the gains track advances in materials, cooling, and compressor design.
Measuring and Simulating Turbine Pressure Ratios
Engineers measure turbine pressure ratio in the test cell and on the aircraft, then use those same signals in FADEC logic and desktop simulation. Getting the measurement chain right is what makes control schedules and virtual prototypes trustworthy.
Measurement Methods
Total pressure at the turbine inlet (station 4) and exit (station 5) is typically captured with:
- Piezoresistive transducers — silicon-on-insulator elements that change resistance under pressure; Kulite builds static-dynamic units for gas-turbine flow instabilities
- Capacitive sensors — pressure-driven diaphragms that alter capacitance; NASA showed integrated sensor/electronics operation at 500°C
- Piezoelectric sensors — membrane force that generates charge in the sensing element
Sensor outputs feed cockpit displays and Full Authority Digital Engine Control (FADEC) systems, which act on pressure ratio in real time.
Engine Control Systems
FADEC uses pressure-ratio data to:
- Hold compressor stall and surge margins
- Limit over-temperature that damages turbine blades
- Meter fuel for max thrust or best SFC
- Drive real-time EPR or N1 (shaft speed) cues for the crew
NASA Glenn control research treats EPR as a primary controlled variable in some architectures, with fuel flow as the manipulated input. That closed-loop dependence on clean pressure-ratio feedback is why teams also rehearse the same signals in software before flight test.
Simulation Applications
Virtual Prototyping and Control Validation
Gas turbine simulation lets engineers sweep pressure ratio across steady and transient conditions before hardware exists. Tools such as SimTurbo support pressure-ratio work through:
- Component-based layouts (inlet, compressor, combustor, turbine, nozzle, shaft)
- Real-time ratio tracking in startup, throttle slam, and surge cases
- Compressor/turbine maps that pair pressure ratio with efficiency
- Operating-point runs across altitude, Mach, and ambient conditions
- Control-law checks that close the loop on pressure feedback
Validation and Accuracy
NASA’s T-MATS toolbox models compressor pressure ratio from corrected-flow, speed, and efficiency maps and matched NPSS results within 0.5% in published comparisons.
SimTurbo’s J85-GE-21 single-spool turbojet model was checked against NASA Lewis Research Center test data and stayed within ±2% on thrust, flow rate, temperature, and TSFC.
Design Optimization
Simulation narrows pressure-ratio choices by:
- Comparing thermal efficiency across OPR and turbine inlet temperature
- Stressing surge margin in transients (often 20–25% in normal operation; afterburner snaps can push it below 5%)
- Trying fuel-flow and variable-nozzle schedules that keep the operating line safe
- Exporting ratio time histories to MATLAB/Simulink or Python for further optimization
Frequently Asked Questions
What is the turbine pressure ratio?
Turbine pressure ratio (TPR) is the ratio of turbine exit total pressure (pt5) to turbine inlet total pressure (pt4). It's always less than 1.0 because pressure drops as the gas expands through turbine stages, extracting energy to drive the compressor and accessories.
What is EPR in a jet engine?
Engine Pressure Ratio (EPR) is exhaust tailpipe total pressure (pt8) divided by engine inlet total pressure (pt2). Unlike TPR, which covers only the turbine, EPR spans the full engine gas path. At low power settings, EPR can fall below 1.0.
What does a 10:1 compression ratio mean?
A 10:1 compression ratio refers to compressor pressure ratio (CPR), not turbine ratio. It means air pressure increases tenfold from compressor inlet to exit. Modern commercial turbofans typically exceed this, with advanced engines reaching 40:1 to 50:1 OPRs.
What compression ratio is best for a turbo?
It depends on the job. Commercial turbofans often run high OPRs (about 40:1–60:1) for cruise efficiency; military engines stay nearer 20:1–30:1 for flexibility and durability. Power-generation units usually favor reliability and long service life over peak ratio.
How does turbine pressure ratio affect engine performance?
TPR directly reflects how much work the turbine extracts. Lower TPR (greater pressure drop) means more work output, which can drive higher compression ratios or provide shaft power for accessories. However, excessive turbine expansion can reduce exhaust velocity and net thrust in jet engines, requiring careful balance.
Can I simulate turbine pressure ratios before building an engine?
Yes. Tools such as SimTurbo model TPR with component maps and thermodynamic solvers so you can try pressure-ratio setups, check control logic, and compare mission points before cutting hardware. That cuts costly build-and-test loops.