As industries face tighter emissions regulations and volatile energy costs, efficiency comparison is no longer academic. According to the U.S. Energy Information Administration's 2024 generator construction cost survey, combustion turbines account for 1,418 MW of installed capacity at an average cost of $841/kW, while reciprocating engines represent 480 MW at $1,490/kW. Meanwhile, a 2021 DOE analysis found that gas turbines account for 64% of installed CHP capacity in the United States, underscoring their dominance in large-scale baseload applications. Selecting the right technology requires understanding not just peak efficiency numbers, but how each performs across the full operating envelope—from startup to part-load to continuous duty.
Key Takeaways
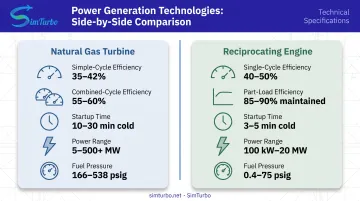
- Simple-cycle gas turbines reach 35-42% efficiency; combined-cycle hits 55-60% for continuous high-power duty
- Reciprocating engines deliver 40-50% single-cycle efficiency and hold 85-90% of peak down to 25% load
- Engines start in 3-5 minutes and handle frequent cycling; turbines need 10-30 minutes and favor baseload
- Choose on scale, load profile, fuel pressure, and lifecycle cost—not peak efficiency alone
- Both platforms are adding hydrogen capability, tighter emissions control, and digital optimization
Natural Gas Turbine vs Reciprocating Engine: Quick Comparison
Side-by-side specs for the metrics that drive efficiency and operating cost decisions:
| Parameter | Natural Gas Turbine | Reciprocating Engine |
|---|---|---|
| Efficiency (Simple/Single-Cycle) | 35-42% (modern units toward the high end) | 40-50% (large lean-burn units) |
| Efficiency (Combined Cycle) | 55-60% (some exceed 64%) | Not applicable |
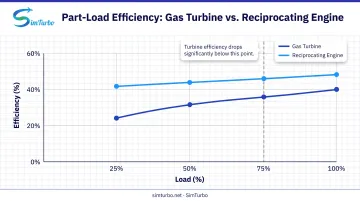
| Part-Load Performance | Significant degradation below 75% load | Maintains 85-90% of peak efficiency at 25% load |
| Startup Time (Preheated/Warm) | 5-10 minutes | 30 seconds to synchronize, 2 minutes to full output |
| Startup Time (Cold) | 10-30 minutes | 3-5 minutes |
| Maintenance Frequency | Routine inspections every 4,000 hours; major overhauls every 25,000-50,000 hours | Routine service every 500-2,000 hours; top-end overhaul every 8,000-30,000 hours |
| Fuel Pressure Requirements | 166.8-538 psig (requires compression infrastructure) | 0.4-75 psig (operates on low-pressure pipeline gas) |
| Typical Power Range | 5 MW to 500+ MW per unit | 100 kW–9.3 MW (EPA examples); modular to 20+ MW |
What is a Natural Gas Turbine?
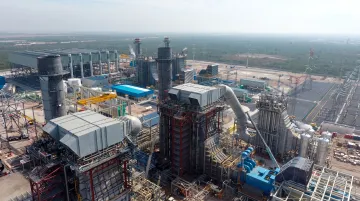
A natural gas turbine is a rotary combustion engine that runs on the Brayton thermodynamic cycle. Air is compressed, mixed with fuel in a combustion chamber, then expanded through a turbine to produce mechanical power.
Unlike reciprocating engines, which burn fuel intermittently in cylinders, turbines use continuous combustion and pure rotary motion. That design removes pistons, crankshafts, and other reciprocating parts.
Why turbines matter for power generation:
- Deliver 3–4× more power per square foot than reciprocating engines, ideal for space-constrained sites
- Exhaust at 800–1,100°F supports high-quality CHP steam (up to 1,200 psig unfired)
- Install outdoors with minimal foundations and a compact footprint, cutting civil costs
- Average 95% fleet availability on clean pipeline gas in baseload service
Turbine Subtypes
Industrial frame turbines are heavy-duty units optimized for baseload operation, ranging from 50-500 MW. The Siemens SGT6-5000F, for example, scales up to 260 MW with 40.0% simple-cycle efficiency and 59.6-59.7% combined-cycle efficiency.
Aeroderivative turbines derive from jet engines, offering faster startup and higher efficiency in smaller packages (5-50 MW). The GE LM6000 achieves 56% combined-cycle efficiency and reaches full load in five minutes.
Microturbines serve distributed applications from 30-350 kW, typically below the scope of utility-scale power generation.
Use Cases of Natural Gas Turbines
Gas turbines dominate applications where high power output, continuous duty, and high-grade heat recovery justify the capital investment:
- Combined-cycle baseload plants over 100 MW, where 55–60% efficiency drives large annual fuel savings
- Industrial CHP at refineries, chemical plants, and factories that need process steam above 150 psig
- Peaking and grid stabilization, with minutes-to-full-load response for frequency regulation and renewable firming
- Oil and gas mechanical drive and remote power, where long maintenance intervals outweigh peak fuel efficiency
Real-world example: The University of Texas at Austin operates a 134 MW campus utility with combustion turbine generators. It reports $1 million in annual cost savings, 8.6 kt CO2 mitigation, and only 11 minutes per year of sustained interruption.
What is a Reciprocating Engine?
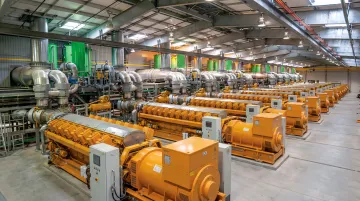
A reciprocating engine, also called a piston engine, is an internal combustion engine that uses pistons moving linearly within cylinders to convert fuel chemical energy into mechanical work.
Natural gas engines typically run on the Otto cycle (spark ignition) or a modified Diesel cycle (compression ignition adapted for gas). Intermittent combustion drives the pistons and crankshaft.
Why reciprocating engines matter for power generation:
- Single-cycle configurations reach 40-50% electrical efficiency without heat recovery
- Hold 85-90% of peak efficiency down to 25% load, which suits variable-load and renewable-integration duty
- Scale in modules from 500 kW to 20 MW for N+1 redundancy and phased capacity growth
- Cold-start in 3-5 minutes (under 2 minutes preheated) for peaking and grid balancing
Reciprocating Engine Variations
Lean-burn spark-ignited engines operate with excess air, producing lower engine-out NOx and higher efficiency. They are common in power generation where emissions permits are strict.
Rich-burn engines use stoichiometric air-fuel ratios with three-way catalytic converters to achieve very low post-control emissions, though at slightly lower efficiency.
Dual-fuel engines can switch between natural gas and diesel backup, providing fuel security for critical facilities and remote sites.
Use Cases of Reciprocating Engines
Reciprocating engines excel in applications where load variability, modularity, fuel flexibility, or low fuel pressure make turbines impractical:
- Distributed generation projects (<50 MW): Data centers, hospitals, universities, and industrial facilities with variable process loads
- Peak shaving and demand response: Fast startup and load-following capability support utility grid balancing and capacity markets
- Microgrids and island power systems: Modular redundancy (N+1) and fuel flexibility ensure reliability in islanded operation
- Wastewater treatment plants: Digester gas and biogas compatibility eliminate fuel costs while providing power and heat
- Renewable energy firming: Rapid response compensates for solar and wind intermittency
Real-world example: The Humboldt Bay Generating Station replaced an aging turbine plant with a Wartsila reciprocating engine facility. The project delivered 33% higher efficiency, 85% fewer ozone-forming compounds, and 34% lower greenhouse gas emissions than the previous plant.
Natural Gas Turbine vs Reciprocating Engine: Which is Better?
Neither technology is universally "better." The optimal choice depends on matching technical characteristics to specific application requirements. Several factors drive the decision:
Power Scale and Load Profile
Engines dominate below 50 MW where modular deployment, phased capacity expansion, and N+1 redundancy matter. EPA examples span 100 kW to 9.3 MW per unit, with installations combining multiple engines to reach total plant capacity.
Turbines dominate above 80 MW where economies of scale favor single large units. Industrial turbines range from 45-62 MW, while heavy-duty frames reach 260 MW or more.
The 50-80 MW range is hybrid territory. Consider load profile, fuel pressure, and lifecycle cost rather than a universal threshold.
Efficiency Across the Operating Range
Peak efficiency tells only part of the story. Part-load efficiency determines fuel cost for facilities with variable loads or renewable integration.
Gas turbines: Efficiency peaks at full load but drops significantly as load decreases. EPA data shows turbine efficiency declining as inlet temperature is reduced at part load, especially at half load and below. Transient operation adds a further efficiency penalty.
Reciprocating engines: Part-load efficiency remains relatively flat. EPA confirms spark-ignition engine efficiency at 50% load is about 8-10% below full-load efficiency—meaning engines maintain strong efficiency across the load spectrum.
Why this matters: For facilities operating below 75% capacity or following renewable output, engines deliver better fuel economy. For baseload plants running at or near full output year-round, turbines' peak efficiency and lower maintenance frequency become decisive.
Operational Flexibility and Response
Startup time:
- Turbines: 5-10 minutes from warm standby, 10-30 minutes from cold start
- Engines: 30 seconds to synchronize when preheated, 2 minutes to full output; 3-5 minutes from cold start
Start/stop tolerance:
- Turbines: Each start consumes equivalent operating hours, making frequent cycling costly and reducing component life
- Engines: Tolerate multiple daily starts with minimal lifecycle penalty, ideal for peak shaving and grid balancing
Ramp rates:
- Turbines: 5-10 minutes to reach full load
- Engines: 10-20 seconds to full load after synchronization
Decision rule: Choose engines if the application requires fast response, frequent cycling, or participation in ancillary services markets. Choose turbines for continuous baseload operation.
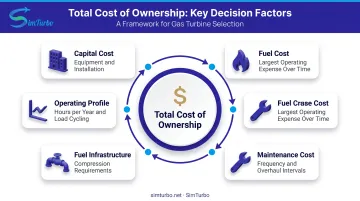
Lifecycle Cost Considerations
Capital cost:
- Turbines: EIA reports $841/kW (2024 installed generator cost), lower upfront investment for large units
- Engines: $1,490/kW, higher initial cost but no fuel compression infrastructure needed
Fuel cost: The largest operating expense. Efficiency differences compound over thousands of operating hours. Model fuel consumption at your expected load profile, not just peak efficiency.
Maintenance cost:
- Turbines: Routine inspections every 4,000 hours, overhauls every 25,000-50,000 hours; lower labor requirements due to fewer moving parts
- Engines: Routine service every 500-2,000 hours (oil changes, filters, spark plugs), top-end overhaul every 8,000-30,000 hours, major overhaul every 30,000-72,000 hours; higher man-hour requirements
Fuel pressure infrastructure:
- Turbines: Require 166.8-538 psig gas pressure, often necessitating gas compressors and associated capital and operating costs
- Engines: Operate on 0.4-75 psig, typically compatible with existing pipeline pressure
Total cost of ownership: Run a lifecycle cost model incorporating fuel price, annual operating hours, load profile, maintenance intervals, and site-specific constraints. Payback varies by duty cycle—no universal threshold exists.
Environmental and Emissions Considerations
NOx emissions:
- Turbines: Modern dry low-NOx (DLN) combustors achieve <9 ppm NOx at 15% O2 without post-combustion treatment, even at 30% low load (Siemens SGT6-5000F example)
- Engines: Lean-burn engines require selective catalytic reduction (SCR) to meet stringent permits; exact certified NOx levels vary by model and year
CO2 emissions: Directly proportional to fuel consumption. Higher efficiency means lower CO2 per MWh. EPA assigns natural gas turbines and engines the same fuel-input CO2 factor (110 lb/MMBtu), so output-based emissions depend on heat rate.
Methane slip: EPA AP-42 uncontrolled CH4 factors show 0.0086 lb/MMBtu for gas turbines, 1.25 lb/MMBtu for four-stroke lean-burn engines, and 0.23 lb/MMBtu for four-stroke rich-burn engines. These are older uncontrolled factors. Verify current certified-product values with manufacturers, as methane is a potent greenhouse gas.
Situational Recommendations
Choose gas turbines if you:
- Need >80 MW continuous baseload power
- Have high-pressure steam requirements (>150 psig)
- Operate >6,000 hours/year in continuous duty
- Have limited footprint or require rapid deployment at large scale
- Have access to high-pressure gas or can economically justify fuel compression
- Prioritize low maintenance frequency and long intervals between overhauls
Choose reciprocating engines if you:
- Need <50 MW modular capacity
- Have variable or peaking loads with significant part-load operation
- Operate <4,000 hours/year in peaking or standby duty
- Need fast startup and load response for grid support or renewable firming
- Have low fuel pressure (standard pipeline gas)
- Require multiple heat recovery streams (exhaust, jacket water, lube oil, aftercooler)
- Need modular redundancy (N+1 configurations)
- Must run on biogas, landfill gas, or dual-fuel with diesel backup
Real World Examples
The University of Texas at Austin and Humboldt Bay Generating Station illustrate how application-specific requirements drive technology selection.
UT Austin Campus CHP System
Challenge: Serve 20 million square feet of campus space (80% research facilities operating continuously) with reliable, cost-effective power and thermal energy. The campus operates as an independent utility with 134 MW generation capacity using combustion turbine generators.
Decision: Select turbines to achieve continuous-duty reliability and campus energy independence. Turbines' longer maintenance intervals and outdoor installation capability supported the utility-scale CHP application.
Outcomes: Through an integrated efficiency and controls program, the campus achieved:
- $1 million annual cost savings
- 8.6 kt CO2 mitigated
- Average 11 minutes per year of sustained interruption (99.998% availability)
These results reflect the broader system (including controls, chilled water, and thermal storage), not turbines alone. They still show the reliability and economic performance turbines deliver in continuous baseload CHP applications.
Humboldt Bay Generating Station
Challenge: Replace an aging turbine power plant with technology that delivers higher efficiency, lower emissions, and improved grid support.
Decision: Install a Wartsila reciprocating engine facility rather than installing new turbines. The engine-based design offered faster response, better part-load efficiency, and flexibility to support renewable integration.
Outcomes:
- 33% higher efficiency than the old plant
- 85% fewer ozone-forming compounds
- 34% lower greenhouse gas emissions
This project provides a direct technology-replacement comparison, showing how reciprocating engines can outperform turbines when the application prioritizes efficiency, emissions, and operational flexibility over raw power density.
How SimTurbo Supports Technology Selection
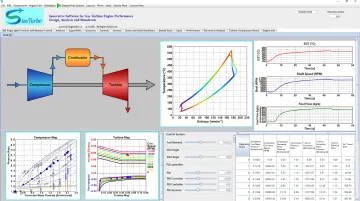
Engineering teams evaluating turbine efficiency, control strategies, and transient performance use simulation to reduce risk before capital decisions. SimTurbo is a cloud-based gas turbine simulation and control design platform. Engineers build component-based turbine models, evaluate efficiency across steady-state and transient conditions, and validate control strategies before physical testing.
SimTurbo's graphical environment provides configurable components so teams can represent aero-derivative and other turbine architectures:
- Compressors, combustors, and turbines
- Recuperators, nozzles, and control elements
Real-time graphs, T-S diagrams, and component maps help assess performance, identify thermal lag, and optimize control loops. The platform's J85-GE-21 validation achieved accuracy within ±2% for thrust, flow rate, temperature, and fuel consumption against NASA test data.
By testing startup profiles, part-load behavior, and control responses virtually, teams can compare technology options and tighten system design before hardware commit.
Conclusion
Neither gas turbines nor reciprocating engines win in every case. The right pick matches machine behavior to the duty cycle you actually run.
Gas turbines fit high-power, continuous baseload service. Compact footprint, high power density, and long maintenance intervals offset higher fuel-pressure needs and lower simple-cycle efficiency. Combined-cycle plants reach 55–60% (and beyond), so turbines lead large central stations on efficiency.
Reciprocating engines lead in distributed generation, peaking, and variable-load work. Simple-cycle efficiency of 40–50%, strong part-load performance, and fast starts improve fuel economy when load swings. They tolerate frequent cycling and run on low-pressure pipeline gas, which suits renewable firming, CHP, and microgrids.
Total lifecycle cost decides the winner more than peak efficiency. Fuel is usually the largest operating expense, so efficiency across the full load range matters more than nameplate ratings. Weigh these factors together:
- Maintenance interval and overhaul cost
- Fuel-pressure infrastructure requirements
- Start/stop and cycling tolerance
- Environmental compliance burden
For power systems engineers, controls engineers, and facility operators, the sound choice comes from how efficiency, response time, and cost interact on real duty cycles—not from a single efficiency number.
Frequently Asked Questions
Which type of engine has the highest efficiency?
Reciprocating engines lead on single-cycle efficiency at 40-50%, versus 35-42% for simple-cycle gas turbines. Combined-cycle gas turbines recover exhaust heat to reach 55-60% (some exceed 64%), so they win when that infrastructure is justified.
What are the key differences between a gas turbine and a reciprocating engine?
Gas turbines use continuous rotary combustion on the Brayton cycle; reciprocating engines use intermittent combustion in cylinders on the Otto or Diesel cycle. Turbines offer higher power density and lower maintenance frequency, while engines deliver higher single-cycle efficiency and better part-load performance.
What is the average efficiency of a gas turbine?
Simple-cycle gas turbines average 35-42% efficiency; aeroderivative units can reach 42-45%. Combined-cycle plants hit 55-60%, with some above 64%. Results also vary with ambient temperature, altitude, and load.
What are the maintenance differences between gas turbines and reciprocating engines?
Gas turbines need inspections about every 4,000 hours and major overhauls every 25,000-50,000 hours, usually with fewer man-hours because they have fewer moving parts. Reciprocating engines need service every 500-2,000 hours, top-end overhauls every 8,000-30,000 hours, and major overhauls every 30,000-72,000 hours.
Which is better for part-load operation: turbines or reciprocating engines?
Reciprocating engines hold 85-90% of peak efficiency down to 25% load. Turbine efficiency falls sharply below 75% load, especially at half load and below. Engines fit variable-load duty and renewable integration better.
How does simulation software help optimize gas turbine efficiency?
Platforms like SimTurbo let engineers model thermodynamic performance, predict efficiency across conditions, and validate control strategies before physical testing. Real-time transient modeling surfaces thermal lag, pressure losses, and control limits, which shortens development time and de-risks capital decisions.