Key Takeaways
- Compression pressure ratio (CPR) is discharge pressure over inlet pressure—and it drives engine efficiency and power
- Higher ratios boost thermal efficiency but raise temperatures, component stress, and material limits
- Multi-stage compression with intercooling reaches higher overall ratios while controlling heat and mechanical loads
- Best CPR depends on operating conditions, materials, weight limits, and the application
What Compressor Pressure Ratio Represents in Gas Turbine Engines
Compressor pressure ratio (CPR) is the ratio of total pressure at compressor exit (pt3) to total pressure at compressor inlet (pt2): CPR = pt3/pt2, always greater than 1.0. NASA station notation defines this with total pressures—not static values—so both static pressure and the dynamic pressure of moving air are included.
CPR serves three roles at once:
- Design parameter – Sets theoretical efficiency limits before the first component is built
- Operating variable – Changes with shaft speed, altitude, and power setting during actual operation
- Performance indicator – Serves as a key metric for comparing engine designs and monitoring health
Relationship to Overall Pressure Ratio
Three pressure metrics get mixed up often—keep them separate:
- Overall pressure ratio (OPR) – All compression from freestream to combustor inlet, including inlet ram compression at high speed
- Stage pressure ratio – Compression across a single compressor stage
- Compressor pressure ratio (CPR) – Compression in the compressor section only, excluding inlet effects
For example, the GE9X turbofan publishes an OPR of 60:1 but a core/compressor PR of 27:1, showing how inlet and fan compression contribute significantly to total pressure rise before air reaches the high-pressure compressor.
Thermodynamic Constraint and Output
In the thermodynamic cycle, CPR is both a limit and a driver. Material temperatures and mechanical stress cap how high it can go, while the ratio itself sets the air density, temperature, and energy available for combustion. The isentropic relation is:
Tt3/Tt2 = (pt3/pt2)^((γ-1)/γ)
Where γ (gamma) is approximately 1.4 for air. This means higher pressure ratios inherently produce higher outlet temperatures. Actual compressor work accounts for efficiency losses:
Work = cp × Tt2 × [CPR^((γ-1)/γ) - 1] / ηc
Where cp is specific heat at constant pressure and ηc is compressor efficiency. Real compression always requires more work than the ideal isentropic case.
Factors That Influence Compression Ratio in Real-World Operation
Atmospheric Conditions
Atmospheric conditions significantly affect compressor performance. Altitude, temperature, and humidity change inlet pressure and density, altering the work required to achieve a target discharge pressure.
The NASA standard atmosphere model defines sea-level conditions as 15.04°C and 101.29 kPa. At high altitude, lower inlet pressure reduces mass flow and changes the effective compression ratio for a given rotor speed.
Because compressor work is proportional to inlet total temperature (Tt2), hot-day operation requires more power to achieve the same pressure ratio. That extra work cuts available thrust and raises temperatures throughout the engine.
Design and Operational Constraints
Material temperature limits are the primary constraint on CPR. Compressor discharge temperature rises with pressure ratio, and blade materials, coatings, and cooling strategies set the upper bounds.
NASA research on nickel-base superalloys targets up to 200°F more operating-temperature capability—or twice the component life at existing temperatures. Safe discharge-temperature limits still vary by engine design and material selection.
Aerodynamic stability boundaries also limit CPR. Efficiency, surge margins, and stall boundaries shift with pressure ratio and operating point. The FAA requires certified engines to prevent surge or stall severe enough to cause flameout, structural failure, overtemperature, or failure to recover thrust.
Designers must balance high CPR goals against stable, wide operating ranges across altitude, speed, and throttle conditions.
Weight trade-offs constrain aerospace applications. Higher CPR requires:
- More compressor stages
- Heavier rotors and shafts
- Stronger casings to contain higher pressures
- Additional cooling systems
These factors directly affect thrust-to-weight ratio, which is critical in aircraft and missile propulsion. A NASA advanced turbofan study found that reducing low-pressure compressor stages from three to two cut engine weight 4.4%, though with a slight fuel-consumption increase.
Range of Compressor Pressure Ratios
Compression ratio varies widely by engine type, mission, and design era. Modern engines reach far higher ratios than early turbojets, thanks to better materials, aerodynamics, and cooling.
Nominal Operating Range by Application
Real-world pressure ratios vary by mission and design priorities:
| Engine | Pressure Ratio | Application |
|---|---|---|
| J85-21 turbojet | CPR 8.30:1 at 100% design speed | Military, 1980 benchmark |
| CFM56-5B/-7B | PR 25.2:1 | Commercial narrowbody |
| F110-GE-129 | PR 30.7:1 at maximum power | Military fighter |
| LEAP-1A/-1B | OPR 40:1 / 41:1 | Modern commercial narrowbody |
| GE9X | OPR >60:1 at maximum power; core PR 27:1 | Advanced wide-body turbofan |
Military engines typically sit in the 25–35:1 range, trading peak ratio for weight and transient response. Modern commercial high-bypass turbofans push 40–60:1 to maximize fuel efficiency.
Industrial gas turbines cover a wider band. The Siemens SGT5-8000H reaches PR 21.0:1, while the smaller SGT-300 runs at PR 13.7:1.
Stage Pressure Ratio Considerations
Individual compressor stages produce varying pressure ratios depending on blade speed, loading, and design. A 1978 NASA single-stage transonic compressor hit design PR 1.82 at 0.845 peak efficiency—proof that a well-designed stage can beat simple rule-of-thumb limits.
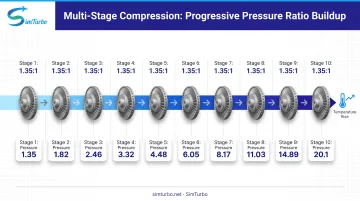
Overall CPR is the product of all stage ratios:
CPR_total = PR_stage1 × PR_stage2 × ... × PR_stageN
For example, a 10-stage compressor with 1.35:1 per stage achieves approximately (1.35)^10 = 20.1:1 overall.
Multi-stage compression with moderate per-stage ratios offers advantages:
- Spreads temperature rise across stages instead of one large jump
- Lowers aerodynamic loading on each blade row
- Improves stage matching and overall efficiency
- Preserves surge margin by limiting diffusion per stage
- Enables interstage cooling in advanced architectures
Boundary Limits and Safety Margins
Maximum CPR is constrained by:
- Compressor discharge temperature: Limits heat load on the combustor and turbine
- Mechanical stress: Blade centrifugal loads and disk burst margins
- Aerodynamic stability: Safe margin from stall and surge boundaries
Engines rarely hold maximum theoretical CPR in continuous operation. Design margins cover transients, in-service degradation, and off-design cases such as hot-day takeoff or high-altitude cruise.
Compressor performance maps plot pressure ratio and efficiency against corrected flow and speed. They mark choke, peak-efficiency, and near-stall points that define the safe operating envelope.
Key Technical Properties of Compression Ratio
Property 1: Relationship to Thermal Efficiency
The ideal Brayton cycle efficiency follows:
η = 1 - 1/PR^((γ-1)/γ)
This relationship shows that higher compression ratios directly increase theoretical thermal efficiency. However, real-world gains flatten at very high ratios due to:
- Compressor inefficiency losses
- Heat transfer to and from components
- Turbine cooling air requirements
- Increased component complexity
A 1969 NASA cycle study found optimum efficiency PR around 15 at turbine inlet temperature (TIT) 1500°F and about 50 at TIT 2500°F. Optimal pressure ratio clearly depends on other cycle parameters.
A later 1987 NASA advanced turbofan study found that raising OPR from 40 to 100 cut thrust-specific fuel consumption about 8.5%. Designers still selected OPR 87 because the extra penalty versus 100 was small—strong evidence of diminishing returns at ultra-high ratios.
Property 2: Temperature Rise and Heat Management
The isentropic temperature-pressure relationship means every CPR increase brings a matching temperature rise. Real compression adds inefficiency heating on top of that ideal gain, so heat management quickly becomes a design constraint.
Common heat-management approaches include:
- Intercooling between compression stages
- Recuperation that transfers exhaust heat to compressed air before combustion
- Nickel-base superalloys with stronger creep and fatigue resistance
- Cooling-air extraction to protect turbine components
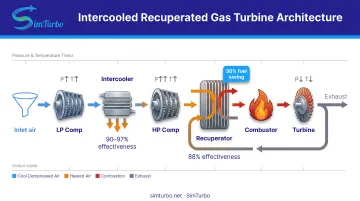
The WR-21 intercooled recuperated gas turbine shows how this works in practice. Its intercooler removes heat after the intermediate-pressure compressor and feeds denser, cooler air to the high-pressure compressor. The recuperator then transfers exhaust heat to the compressed air before combustion.
Reported results include intercooler effectiveness of 90% at full power and 97% at 30% power, recuperator effectiveness above 88%, and a 30% fuel saving versus a simple-cycle propulsion engine.
Property 3: Coupling with Engine Performance Parameters
CPR interacts with multiple engine parameters at once. The 1987 NASA study selected OPR 87, TIT 3085°R (1713°C), fan pressure ratio 1.55/1.4, and bypass ratio 18 as one integrated set.
Lower fan pressure ratio pushed optimum bypass ratio upward and cut fuel burn, but it also increased engine size and drag. Flowpath work traded stages, blade loading, tip speed, stress, pressure ratio, efficiency, and weight together.
Key trade-offs include:
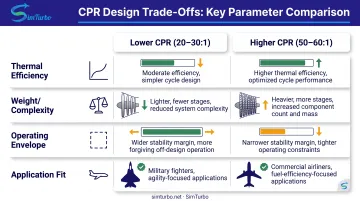
- Higher CPR improves cycle efficiency but adds stages, mass, and complexity
- Advanced materials and cooling enable higher CPR at higher manufacturing cost
- Best CPR for maximum thrust differs from best CPR for minimum fuel burn
- Ultra-high CPR narrows the stable operating envelope
Mission profile sets the priority. A fighter favors thrust-to-weight and transient response, so it accepts lower compression ratios. A long-range airliner favors fuel efficiency and can justify the weight and complexity of higher ratios.
Engineers typically evaluate these coupled effects in steady-state cycle analysis and compressor-turbine matching studies before locking a design CPR.
How Compression Ratio Is Specified, Measured, and Validated
Specification in Design and Documentation
CPR appears in engine specifications, performance maps, and design documentation, typically defined at key operating points: takeoff, cruise, and idle. Published values usually reflect design-point operation at standard atmospheric conditions, with tolerances for manufacturing variation and degradation over service life.
Different pressure metrics serve different purposes:
- Stage PR for component design and matching
- Compressor PR for core compressor section performance
- Overall PR (OPR) for total engine compression, including inlet and fan
Always verify which pressure stations define a published ratio and at what operating condition it applies.
Measurement and Verification Methods
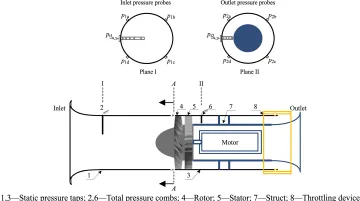
Total pressure measurement uses probes aligned with the flow direction. A total-pressure rake uses parallel flow-aligned tubes connected to external pressure transducers, mapping total-pressure distribution across the compressor face.
A 2015 NASA/ASME compressor rig used:
- Inlet and exit total-pressure/temperature rakes
- Five-hole probes for detailed flow mapping
- Stator probes between stages
- Static pressure taps on the casing
- Kulite dynamic-pressure sensors for unsteady measurements
Reported accuracies included ±0.015 psi inlet static pressure, ±0.03 psi exit static pressure, and ±1.04% mass flow.
Validation compared measured performance maps with design intent and CFD predictions. Unpredicted front-stage losses caused an efficiency shortfall and stage mismatch—one reason physical testing still matters.
Test-cell versus in-flight measurements differ significantly. Test cells provide controlled conditions with steady inlet flow, precise instrumentation, and repeatable atmospheric conditions. In-flight measurements encounter actual inlet distortion, atmospheric variation, shaft transients, and aircraft maneuvers. Distortion screens upstream of the compressor provide controlled inlet-compatibility testing before flight trials.
Physical rigs cannot cover every off-design or transient case before hardware is built. Platforms such as SimTurbo let engineers check compressor performance and compression ratios with real-time physics-based models, then compare those results against rig and flight data.
Implications of Operating Outside the Recommended Compression Ratio Range
Both under-compression and over-compression create distinct performance and safety concerns. Operating beyond design boundaries jeopardizes engine reliability, efficiency, and certification compliance.
Under-Compression Consequences
When compressor pressure ratio falls below design targets:
- Thermal efficiency drops because Brayton cycle efficiency scales directly with pressure ratio
- Specific thrust falls as lower combustor inlet pressure and density cut thrust per unit airflow
- Combustion can destabilize when pressure and temperature cannot sustain flame anchoring
- Fuel-air mixing weakens from reduced turbulence and shorter residence time
- Power output misses design targets and limits aircraft performance
Over-Compression Risks
Excessive pressure ratio creates more severe hazards:
- Discharge temperature climbs high enough to damage compressor blades and downstream combustor or turbine parts through oxidation and creep
- Surge or stall beyond the stability boundary can trigger violent flow reversal, flameout, or mechanical failure
- Higher stress and temperature accelerate creep, fatigue, and crack growth
- Extreme mechanical loads risk disk burst, blade liberation, or shaft failure
FAA regulations require that surge or stall not produce flameout, structural failure, overtemperature, or failure to recover thrust. Operating beyond certified limits may void warranties, violate airworthiness directives, and drastically reduce component life.
Common Misinterpretations of Compression Ratio in Practice
Three misconceptions show up often when engineers compare compressors or read published specs.
Higher CPR Always Means Better Performance
Optimal CPR depends on mission profile, weight constraints, and system integration—not raw ratio alone. Ultra-high CPR engines can be heavier, more complex, and more expensive. They also fit poorly when you need rapid throttle response or compact packaging.
A fighter aircraft gains more from moderate CPR with strong transient performance than from maximum CPR with sluggish acceleration.
Confusing OPR with CPR
Overall pressure ratio includes inlet ram compression and fan compression in turbofans. Compressor pressure ratio measures only the core compressor section.
The GE9X's 60:1 OPR versus 27:1 core PR shows that gap clearly. Always verify pressure-station definitions before comparing published values.
Assuming CPR Stays Constant
Compression ratio varies with shaft speed, inlet conditions, and power setting. Compressor maps plot pressure ratio against corrected flow and speed. The operating point moves from choke at low speed through best efficiency to near-stall at high load.
Published catalog values typically represent design-point operation, not idle, startup, or transient conditions.
Conclusion
Compressor pressure ratio sets efficiency potential, temperature rise, and mechanical design limits in gas turbine engines. Higher ratios generally improve cycle efficiency under Brayton cycle theory, but practical designs still have to balance CPR against material limits, weight, cost, operability, and mission needs.
Theory and simulation together help engineers choose workable compression ratios and tune performance for the application. Tools like SimTurbo support quick exploration of compressor matching, off-design operation, and control strategies, complementing physical testing and shortening development cycles.
Frequently Asked Questions
What is the pressure ratio in a compressor?
Compressor pressure ratio (CPR) is the ratio of total pressure at the compressor exit to total pressure at the inlet, expressed as CPR = pt(exit)/pt(inlet). It quantifies how much the compressor increases air pressure, including both static and dynamic pressure.
What is a good compressor ratio?
"Good" compression ratio depends on the application. Military engines often run about 25-35:1 for performance and weight; modern commercial turbofans reach 40-60:1 for efficiency. The best CPR balances efficiency against temperature limits, complexity, weight, and mission needs.
How does compression ratio affect engine efficiency?
Higher compression ratios raise theoretical thermal efficiency per the Brayton cycle: η = 1 - 1/PR^((γ-1)/γ). In practice, gains taper at very high ratios because of compressor losses, heat rejection, turbine cooling demand, and added complexity—especially as turbine inlet temperature limits are reached.
What is the difference between overall pressure ratio and stage pressure ratio?
Stage pressure ratio is the rise across one stage (typically 1.2-1.8:1). Overall pressure ratio is the product of all stages across the compression system (often 20:1 to 60:1). On the GE9X, about 60:1 OPR includes fan and inlet work, while the core compressor is nearer 27:1.
Why do multi-stage compressors use lower compression ratios per stage?
Lower per-stage ratios limit temperature rise and blade loading, which improves efficiency and surge margin. That keeps surface velocities in check and reduces boundary-layer separation risk. Some designs add intercooling between stages to drop temperature and raise density before the next stage.
How is compression ratio validated in gas turbine engine development?
Validation pairs test-cell data with simulation. Rakes, static taps, and temperature probes at inlet and exit measure actual pressure rise against design. Tools like SimTurbo let teams explore off-design, transient, and control behavior virtually before hardware builds, cutting time and cost.