While a natural gas engine may achieve 35-42% electrical efficiency, micro gas turbines without recuperation struggle to reach even 20%. This performance gap translates directly into fuel costs, payback periods, and operational viability. However, when properly configured with recuperators and operated in CHP mode, these compact turbines can achieve total system efficiencies exceeding 85%, making them competitive in applications with coincident electrical and thermal loads. This article examines the efficiency fundamentals, explores the factors that most dramatically affect performance, and identifies proven strategies for optimization.
Key Takeaways
- Recuperators roughly double electrical efficiency from 16–20% to about 30–33%
- CHP setups reach 60–85% total efficiency by capturing exhaust heat for steady thermal loads
- High ambient temperatures and partial loads cut output—size systems for real operating conditions
- Intercooling with two-stage compression has hit 42% electrical efficiency in research settings
- Component-based simulation lets engineers model recuperated cycles before physical prototyping
Understanding Micro Gas Turbine Efficiency Fundamentals
Three metrics define how well a micro gas turbine turns fuel into useful energy:
- Electrical efficiency: Net electrical output divided by fuel energy input (LHV or HHV), as a percentage
- Thermal efficiency: Useful recovered heat divided by fuel input
- Total CHP efficiency: (Net electric output + useful thermal output) / fuel input
The Brayton Cycle Foundation
Micro gas turbines operate on the Brayton thermodynamic cycle. Air enters a compressor, then passes through a recuperator before the combustor. Fuel burns in the combustor, hot gas expands through the turbine, and exhaust heat transfers back through the recuperator.
Commercial units typically use centrifugal compressors, radial turbines, and variable shaft speeds to balance performance across operating conditions.
Current Industry Benchmarks:
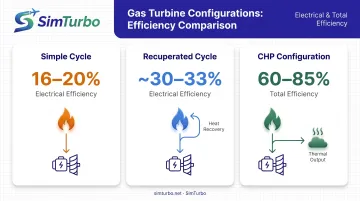
- Simple cycle (no recuperator): 16-20% electrical efficiency
- Recuperated cycle: ~30% typical; leading units reach 33% LHV
- CHP total efficiency: 60-70% standard; some heat-recovery setups exceed 85-90%
For example, the Flex GT333S delivers 333 kW at 33% LHV electrical efficiency with over 85% total CHP efficiency. The Capstone C200S achieves 200 kW at 33% LHV with up to 90% CHP performance.
Why Micro Turbines Trail Large Industrial Turbines
Large gas turbines achieve 35-40% simple-cycle efficiency and about 60% in combined-cycle configurations. Smaller machines lag for several reasons:
- Component size: Small radial-flow compressors and turbines lose more to surface-area-to-volume and tip-clearance effects than large axial-flow parts
- Single-stage compression: Micro units run near 4:1 pressure ratio; large turbines reach 15-20:1 with multi-stage compression
- Lower turbine inlet temperatures: Material cost limits typically hold TIT near 950-1,000°C versus 1,400-1,600°C in industrial machines
- Leakage sensitivity: Compact packaging raises relative leakage; 1% combustor-inlet-to-turbine-exit leakage can cut thermal efficiency by 0.41-0.45 points
Major Factors Affecting Micro Gas Turbine Efficiency
Recuperator Performance
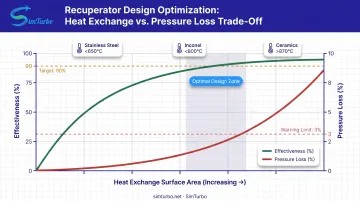
The recuperator preheats compressed air using exhaust heat before it enters the combustor, reducing the fuel required to reach turbine inlet temperature. Target specs typically call for effectiveness above 90% with relative pressure loss below 3%.
Effectiveness measures how much heat the recuperator actually transfers compared to the theoretical maximum. A 90% effective recuperator recovers 90% of the available temperature difference between hot exhaust and cold compressed air. This single component can more than double baseline efficiency. A 16% simple-cycle machine often becomes a 30–33% recuperated system.
Trade-offs manufacturers must balance:
- Larger heat-exchange area raises effectiveness but also size, weight, and cost
- Higher effectiveness usually needs more flow-path length or surface area, which raises pressure drop
- Pressure loss above 3% per side cuts net cycle efficiency despite better heat recovery
- Material choice caps temperature: stainless below 650°C, Inconel below 800°C, ceramics above 870°C
Pressure Ratio and Turbine Inlet Temperature
Micro gas turbines typically operate at pressure ratios of 3-4:1, well below large industrial turbines. That range fits small single-stage centrifugal compressors and the Brayton cycle’s sensitivity to component efficiency at small scale.
TIT limits come from material cost more than technical capability. While large industrial turbines use advanced cooling and expensive superalloys to achieve 1,400°C+, microturbines economically limit TIT to approximately 950-1,000°C. Research units with ceramic components have operated at 1,350°C, enabling efficiency gains of several percentage points.
The AE-T100 micro turbine specifies combustion-chamber pressure of 4.5 bar(a) and TIT of 950°C, while Niigata's RGT3R operated at PR 4.02 during development testing.
Component Efficiency and Losses
Each component in the flow path contributes to overall system performance:
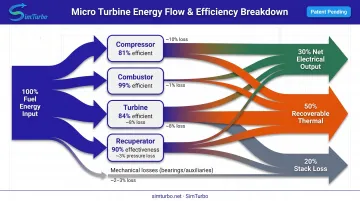
- Compressor: work required for the target pressure ratio; development units have reached at least 81% efficiency
- Turbine: power extracted from hot gas; advanced models often assume about 84% per stage
- Combustor: completeness of fuel burn; modern designs exceed 99% at design conditions
- Mechanical losses: bearing friction, windage, and auxiliaries—percentages vary by design
Small radial-flow parts face hard geometric limits. Blade heights are short relative to tip clearances, so leakage takes a larger share of the flow. Higher surface-area-to-volume ratios also amplify heat loss and boundary-layer effects.
Those scaling penalties are why a 300 kW microturbine cannot match the component efficiencies of a 300 MW combined-cycle plant. Cycle simulation helps quantify how each loss stacks when you change PR, TIT, or recuperator effectiveness.
Ambient Conditions and Operating Environment
Design-point efficiency is only half the story—site weather and elevation shift real output. Temperature usually dominates the derate:
- A validated 200 kW off-design model showed about a 4 percentage-point electrical efficiency swing from -18°C to 50°C
- Cold, dense air helps compressor work and mass flow; hot ambients cut both power and efficiency
- Altitude trims performance by roughly 3.5% per 1,000 feet from lower air density
- Humidity affects combustion and heat capacity, but less than temperature or altitude in most installs
Manufacturers rate units at ISO conditions (15°C, 14.696 psia, 60% RH). Field results diverge fast: a 200 kW sea-level rating may deliver only ~170 kW at 5,000 feet on a hot afternoon.
Part-Load Operation
Once the machine leaves full load, efficiency falls hard—often as much as or more than reciprocating engines. Recips historically lose about 8–10% efficiency at 50% load; microturbines see similar or worse drop-off.
Fixed-geometry components run off their design points at lower mass flow. Compressor and turbine efficiency slip, combustion can go less complete, and heat losses claim a larger share of total energy.
Mitigation strategies:
- Bank multiple smaller units and stage them so running machines stay near full load
- Size for typical load, not peak, and accept some penalty in low-demand hours
- Use tighter fuel scheduling and variable geometry (where available) to limit off-design loss
Strategies for Optimizing Micro Gas Turbine Efficiency
Advanced Recuperator Designs
Primary-surface recuperators rank ahead of plate-fin and tubular designs for micro gas turbine service due to superior effectiveness-to-pressure-drop ratios. These designs use formed sheets to create flow channels, maximizing heat-transfer area while controlling pressure loss.
Ceramic recuperators tolerate temperatures above 870°C versus below 650°C for stainless steel, enabling higher TIT operation without elaborate cooling systems. Studies link ceramic recuperators to cycle efficiencies approaching 40%, though durability and cost still limit commercial adoption.
Japan's NEDO program demonstrated 42.1% thermal efficiency at 1,350°C TIT with its 300 kW-class CGT302 ceramic gas turbine in March 1999, accumulating over 2,000 hours at 1,200°C. That result remains the benchmark for experimentally achieved micro gas turbine efficiency, though the program ended without commercial production.
Annular recuperators wrap around the engine core in a compact package, ideal for space-constrained installations. The design challenge is balancing thermal performance, mechanical integrity, and manufacturing cost.
Intercooling and Two-Stage Compression
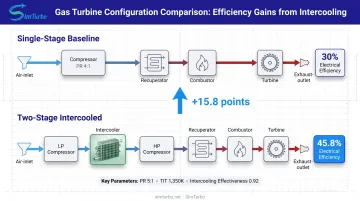
Cooling compressed air between compression stages cuts the work required for the next stage and improves net cycle efficiency. A 2015 concept study by Lappeenranta University and Aurelia modeled a two-stage, two-shaft system with intercooling that reached 45.8% electrical efficiency at pressure ratio 5 and TIT 1,350 K. Intercooling effectiveness of 0.92 contributed 3.5 percentage points of that gain.
Intercooling pairs especially well with recuperation when pressure ratios push above the typical micro-turbine range of about 3–5. Cooler compressor discharge reduces compression work and can widen useful temperature differences in the recuperator.
Simulation and Design Optimization
Those hardware choices only pay off if the cycle is balanced. Component-based simulation lets engineers model recuperated Brayton cycles, compare configurations, and check performance predictions before building hardware. Teams can sweep recuperator effectiveness, pressure ratio, TIT, and component efficiencies to find workable design points.
For professional design and classroom use, platforms like SimTurbo provide real-time thermodynamic cycle visualization, compressor-turbine matching, and transient simulation. That combination supports university instruction and research on advanced cycle configurations aimed at higher efficiency.
Key simulation capabilities:
- Steady-state cycle analysis with T-S and P-V diagrams
- Off-design performance prediction across varying ambient conditions
- Component map integration for compressors and turbines
- Recuperator effectiveness and pressure-loss trade-off studies
- Transient behavior including startup, load changes, and control-system response
Operational Optimization Techniques
Beyond hardware design, several operational factors affect efficiency:
- Maintain proper fuel pressure and flow control for complete combustion and stable operation
- Inspect and clean recuperators, compressors, and combustors on a set schedule to limit performance drift
- Tune fuel schedules and protection logic to balance efficiency against surge margin and TIT limits
- Keep inlet filtration effective so compressor fouling does not erode design performance
Remote monitoring helps operators track efficiency in real time, compare it with baselines, and spot degradation early. Many plants fold those feeds into SCADA for facility-wide optimization.
Future Efficiency Pathways
Research programs targeting 40-42% electrical efficiency focus on:
- Ceramic hot-section and recuperator parts that support TITs of 1,350°C and higher
- Magnetic or air bearings that cut friction losses versus oil-lubricated rotors
- Combustors that hold low emissions at higher temperature and pressure
- Additive manufacturing for internal geometries conventional machining cannot produce
Combined Heat and Power Applications and Efficiency Benefits
CHP systems capture waste heat from turbine exhaust and put it to work, raising total system efficiency well above electricity-only operation.
After the recuperator, exhaust typically leaves at 270–507°C (about 520–945°F). That stream supports hot water, space heating, absorption cooling, or industrial process heat.
Total CHP efficiency calculation:
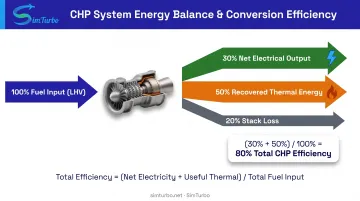
Total efficiency = (net electricity + useful thermal energy) / total fuel input
A recuperated microturbine with 30% electrical efficiency and 50% recovered thermal efficiency delivers 80% total CHP efficiency—nearly tripling the useful energy extracted from each unit of fuel compared to electricity-only operation.
Real-World CHP Performance
The Albert Lea wastewater treatment facility in Minnesota installed four 30 kW Capstone units fueled by digester biogas. The 120 kW system generates about 800,000 kWh annually and covers roughly 25% of site energy needs.
Recovered heat maintains digester temperature and supports space heating. Payback period: 4–6 years.
During Superstorm Sandy, a 65 kW natural-gas microturbine CHP system at a Manhattan data center kept computer and lighting loads online for more than two days of utility outage. Recovered heat powered absorption cooling, so the site held both power and thermal service when the grid failed.
Power-to-Heat Ratio and Application Fit
Micro gas turbines typically deliver power-to-heat ratios of 0.5-0.7, meaning each kW of electricity comes with approximately 1.4-2.0 kW of recoverable thermal energy. This ratio determines application suitability:
Ideal applications:
- Wastewater treatment plants (digester heating, space heating)
- Universities and hospitals (hot water, space heating, absorption cooling)
- Data centers (cooling via absorption chillers, space heating)
- Industrial facilities with steady thermal loads (process heating, hot water)
Poor fit:
- Facilities with electricity-only demand
- Sites where thermal loads don't coincide with electrical demand
- Applications requiring very high-temperature process heat (above exhaust temperature)
Size the unit from matched electrical and thermal load profiles. Recovered heat only pays off if you can use it productively year-round, not only in heating season.
Micro Gas Turbines vs. Reciprocating Engines: Efficiency Comparison
When evaluating distributed generation in the 25-500 kW range, electrical efficiency and heat recovery drive fuel cost and payback.
Electrical Efficiency
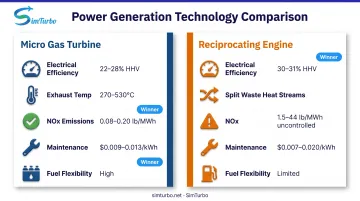
- Micro gas turbines: 22-28% HHV (EPA 2014 benchmark). Leading recuperated units reach about 30-33% on an LHV basis—higher on paper, but not directly comparable to HHV engine figures
- Natural gas reciprocating engines: Typical 100-300 kW units deliver about 30.6-31.1% HHV
- CHP total efficiency: Both can reach high overall efficiency when heat is used; the gap is how easily that heat is recovered
Natural gas engines win on pure electrical efficiency, which lowers fuel cost per kWh. That edge shrinks or flips in CHP service, where microturbines’ cleaner, hotter exhaust is easier to recover.
CHP Characteristics
- Microturbines: One hot exhaust stream at 270-530°C—well suited to heat-recovery exchangers, absorption chillers, and direct process heat
- Reciprocating engines: Waste heat split between exhaust and jacket water, so you need separate recovery loops and usually get lower-grade heat
Efficiency-Related Trade-offs
- Emissions: Microturbines: 0.08-0.20 lb NOx/MWh with no after-treatment. Engines: 1.5-44 lb/MWh uncontrolled, often needing catalysts that cut NOx 80-90%
- Maintenance: Microturbines: about $0.009-0.013/kWh and 98-99% availability. Engines: about $0.007-0.020/kWh, with availability often a few points lower
- Part-load efficiency: Engines hold up better off-design (roughly 8-10% penalty at 50% load). Microturbines lose more efficiency at partial load
- Fuel flexibility: Microturbines accept low-Btu, sour, and landfill gases more readily. Engines need cleaner fuel
If electrical efficiency and capital cost per kW come first, engines often win. If ultra-low emissions, light maintenance, fuel flexibility, or high-quality waste heat matter more, microturbines are the stronger fit despite lower electrical efficiency.
Measuring and Monitoring Efficiency Performance
Key performance metrics:
- Electrical efficiency (%): Net kW output / (fuel flow × fuel heating value) × 100
- Heat rate (Btu/kWh or MJ/kWh): Fuel energy per unit electricity produced; lower is better
- Fuel consumption rate: Actual fuel used per hour at specific loads
- Exhaust temperature: Indicates available thermal energy and can signal performance degradation
Continuous monitoring systems track these parameters in real time, comparing actual performance against manufacturer specifications and historical baselines. Deviations indicate maintenance requirements, control-system issues, or ambient-condition effects.
Remote SCADA capabilities enable facility managers to monitor multiple sites, adjust operating parameters, and trend efficiency over weeks or months. They also issue alarms when performance degrades. Gradually rising exhaust temperature or declining electrical efficiency, for example, may signal recuperator fouling or compressor degradation that needs cleaning or inspection.
Those field signals are only useful if you can judge them against a sound baseline. Performance validation compares measured data with expected values from manufacturer specifications or simulation models run at matching ambient and load conditions. Discrepancies help identify calibration errors, instrumentation problems, or actual equipment degradation. ASME PTC 22 governs gas turbine thermal performance tests and sets standardized methods for acceptance testing and ongoing verification.
Future Trends in Micro Gas Turbine Efficiency
Research targets of 40-42% electrical efficiency are achievable through coordinated advances in materials, cycle design, and controls.
Advanced materials enable turbine inlet temperatures of 1,350°C and higher, directly improving thermodynamic efficiency. Ceramic matrix composites deliver that temperature capability without the cooling air metallic parts need, cutting parasitic losses and raising net performance. Manufacturing challenges and long-term durability still limit commercialization.
Sophisticated cycle designs combine intercooling, two-stage compression, and optimized recuperation. Modeling shows well-executed implementations can reach 45-46% electrical efficiency. The tradeoff is higher capital cost and less of the simplicity that has favored microturbines over reciprocating engines.
Hybrid configurations open additional paths:
- Solar-heated compressed air: A validated 2018 model paired a 100 kWe microturbine with a solar tower, reaching 31.5% electrical efficiency and 26% lower gas use at rated output
- Hydrogen fuel: Studies model 0-100% hydrogen blends with electrolyzer and storage for renewable-energy firming
- Energy storage: Batteries or thermal storage keep the turbine at a steady, efficient load while serving variable demand
Digital twins and AI-based optimization help operators hold efficiency under real plant conditions. A 2026 study of a 100 kW digital-twin model cut prediction error by 1.8 percentage points versus a physics-only model and 4.7 points versus a data-only model as ambient temperature changed.
These tools do not rewrite thermodynamic limits. They do enable real-time efficiency tuning, proactive maintenance, and faster fault diagnosis across varying conditions.
Frequently Asked Questions
Which turbine has the highest efficiency?
Among commercially available micro gas turbines, recuperated models from Flex Energy (GT333S at 33% LHV) and Capstone (C200S at 33% LHV) represent current efficiency leaders in the 200-330 kW range. Research prototypes have demonstrated 42% efficiency using ceramic components and elevated turbine inlet temperatures.
What is the typical efficiency of a micro gas turbine without a recuperator?
Simple-cycle micro turbines achieve 16-20% electrical efficiency. That level is commercially unviable for most uses, so recuperators are standard on nearly all modern stationary microturbines.
How does micro gas turbine efficiency compare to larger industrial gas turbines?
Large gas turbines achieve approximately 35-40% simple-cycle efficiency and about 60% or higher in combined-cycle configurations. The gap comes from higher pressure ratios (15-20:1 vs. 3-4:1), multi-stage axial components, and higher turbine inlet temperatures from advanced cooling and materials.
What is the most important factor for improving micro gas turbine efficiency?
Recuperator effectiveness is the single most impactful factor, capable of more than doubling baseline efficiency from 16-20% to 30-33%. Target specifications call for effectiveness greater than 90% with pressure loss below 3% to optimize the trade-off between heat recovery and flow losses.
Can micro gas turbines achieve 40% electrical efficiency?
Japan's NEDO program demonstrated 42.1% efficiency in 1999 with the CGT302 ceramic gas turbine at 1,350°C TIT, and later modeling of intercooled two-stage systems predicts 45-46%. No commercial micro turbine currently offers 40%+ electrical efficiency—cost and durability still limit advanced materials and higher TIT.
Why do micro gas turbines lose efficiency at partial loads?
Off-design operation moves compressors and turbines off their best points on the performance maps, so component efficiencies drop. Fixed-geometry machines cannot reshape flow paths at lower mass flow, and heat losses plus friction claim a larger share of total energy at reduced load.