Engineers who only analyze the design point are flying blind for the other 95% of an engine's operating life. Off-design performance analysis fills that gap, predicting how thrust, power, efficiency, and temperatures shift once conditions move away from the reference case.
The stakes are real. NASA's own J85-21 test history documented 79 stalls and turbine damage during a single test campaign, a reminder of how unforgiving compressor behavior can get outside its comfort zone (NASA TM-81451). This article walks through what off-design analysis actually involves, why it matters, and how modern tools like SimTurbo are changing the workflow.
TL;DR
- Off-design analysis predicts gas turbine behavior away from the design point using component maps and matching techniques
- Essential for throttle transients, altitude and temperature changes, degradation tracking, and control-law validation
- Manual iteration is slow and error-prone; component-based simulation software solves the same equations in real time
- Validation against test data, such as NASA's J85-GE-21 dataset, separates a credible model from a guess
What Is Off-Design Performance Analysis?
Off-design performance analysis is the process of predicting a gas turbine's thrust, power, efficiency, and temperatures at conditions that differ from its rated design point. NASA describes it functionally: calculating performance at varying flight conditions and throttle settings using the design point as the reference data set (NASA TM-2005-213659).
It shows up across the engine lifecycle:
- Engine development - verifying performance across the full flight envelope before hardware exists
- Flight envelope clearance - proving the engine survives extreme altitude, Mach, and temperature combinations
- Control-system design - tuning acceleration and deceleration schedules
- Retrofit and upgrade studies - checking if a new component fits the existing engine's operating range
- Field troubleshooting - explaining why a running engine underperforms its spec sheet
Two distinctions shape how you run that analysis:
- Steady-state vs. transient - Steady-state covers on-design and off-design points but reveals almost nothing about spool-up time or transient surge margin, per NASA's dynamic systems research (NASA TM-2016-219133)
- Manual iteration vs. software-driven simulation - Solving the equations by hand can take days; a solver converges in real time
Why Off-Design Analysis Is Critical for Gas Turbine Engineers
Engines rarely sit at their design point. A commercial turbofan spends minutes at takeoff thrust and hours at cruise. A power-gen turbine idles overnight and spikes during peak demand. Off-design analysis is what makes that variability survivable. Off-design analysis helps you:
- Predict surge and stall margins under partial load or extreme ambient conditions
- Plan fuel efficiency across throttle settings and altitudes
- Identify component mismatches before expensive hardware testing
- Tune control laws for acceleration and deceleration transients
- Track lifecycle and degradation trends as engines age
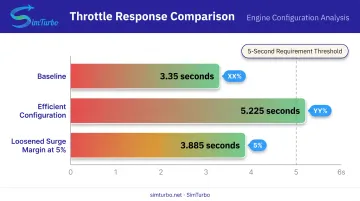
- Validate models against real engine test data The trade-offs are documented, not theoretical. With NASA's TTECTrA tool, researchers designed acceleration/deceleration limiters to protect surge margin on a simulated CMAPSS40k engine. A more efficient configuration had a slower 5.225 seconds response time versus 3.35 seconds for the baseline. Loosening the compressor surge-margin limit to 5% cut response time to 3.885 seconds and met a 5-second requirement (NASA, 2014). That's the core tension: fuel efficiency, response speed, and surge margin all pull in different directions. You can't tune one without modeling the others.
How Off-Design Analysis Works – Step by Step
Here is the practical sequence engineers actually follow—and the mistakes that derail it most often: leaning on design-point assumptions past their validity range, extrapolating compressor maps beyond their tested region, or skipping validation against test data entirely.
Step 1 – Define the Operating Envelope
Identify the altitude, Mach number, ambient temperature, and load range you need to analyze. Skip this and everything downstream becomes guesswork.
Step 2 – Gather Component Maps and Baseline Data
Collect compressor and turbine performance maps, design-point cycle data, and known test benchmarks. NASA's NNEP methodology represents compressor and turbine behavior using corrected-flow, pressure-ratio, and efficiency tables plotted against corrected speed, scaled to the design point (NASA TM-101433). Bad maps in, bad predictions out.
Step 3 – Set Up Component Matching Equations
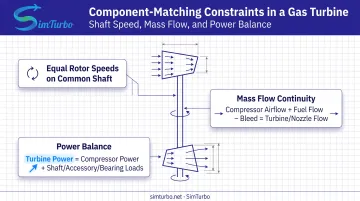
Establish the compatibility constraints between compressor, combustor, and turbine. ASME defines matching as the process of integrating components to predict overall gas turbine performance. The core relations, first codified by NASA in 1951, still hold (NASA TN-2450):
- Compressor and turbine rotor speeds are equal on a common shaft
- Compressor airflow plus fuel flow, minus bleed, equals turbine and nozzle flow
- Turbine power equals compressor power plus output-shaft, accessory, and bearing loads
Step 4 – Run the Simulation
Solve the matched system, either iteratively by hand or in real time with software, across every defined operating point. NASA's own example solves 18 variables with 18 equations using Newton iteration for control-limit temperatures - not a trivial hand calculation (NASA TM-2005-213659).
Step 5 – Interpret Results
Look at surge margins, thermal limits, specific fuel consumption, and transient response trends. This is where you decide: is the configuration safe across the envelope, or does it need a redesign?
Step 6 – Validate and Refine
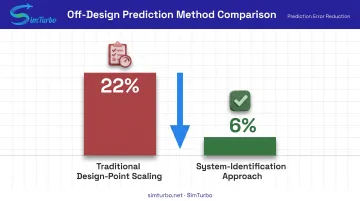
Compare simulation output against test-cell or field data. One peer-reviewed comparison found traditional design-point scaling produced up to 22% error off-design, while a system-identification approach cut that to 6% (ASME, 2003). That gap is the entire reason validation isn't optional.
Off-Design Analysis – Example Case Walkthrough
Consider a generic single-spool turbojet being evaluated at a part-load throttle setting below its rated design point.
The process looks like this:
- Define the part-load condition (reduced fuel flow, lower corrected speed)
- Pull the compressor and turbine maps at the corresponding corrected speed lines
- Set matching constraints — shaft speed, mass flow continuity, and power balance
- Solve for the new equilibrium operating point
Watch the nonlinear response. The most common mistake is assuming performance scales linearly with throttle position. It doesn't. Compressor and turbine efficiency, pressure ratio, and surge margin all move along their map curves in nonlinear ways.
A 10% throttle cut might cost you 3% surge margin at one operating point and 15% at another, depending on where you sit on the map. That is exactly what the matching solve is meant to expose.
Once the model returns results—predicted turbine inlet temperature, surge margin, and the rest—check them against reference test data. If the model tracks within an acceptable tolerance, treat it as validated. If not, refine the maps or assumptions and resolve until it does.
Only a validated model should drive a real decision, such as adjusting a fuel schedule or tightening a control limit.
How SimTurbo Can Help
Manual component matching and hand iteration have bottlenecked off-design analysis for decades. SimTurbo, built by Controls Research LLC, replaces that loop with a real-time, component-based simulation environment that runs on a standard Windows PC.
SimTurbo's Off-Design Simulation Capabilities
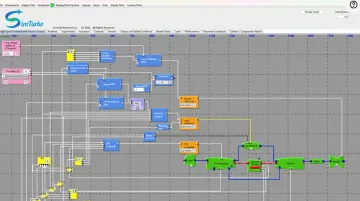
Instead of treating the engine as a black box, SimTurbo models each component individually: inlets, compressors, combustors, turbines, and nozzles, connected through shaft logic. Engineers can pinpoint where a mismatch starts rather than chasing an aggregate output that will not reconcile.
Key capabilities include:
- Real-time simulation of transient and steady-state off-design conditions across altitude, Mach number, and ambient temperature
- Component-based architecture with mass-flow conservation built into the solver
- Built-in Speed PID, Temperature PID, and Surge Margin PID controllers, plus FADEC logic and limiters, for control-law validation
- Validated accuracy against NASA Lewis J85-GE-21 test data within ±2% for thrust, flow rate, temperature, and TSFC
- CSV and Excel export for post-processing in MATLAB/Simulink or Python
- Single-spool and dual-spool turbojet support, plus recuperated and afterburning cycles
In one documented transient example, surge margin holds at a healthy 20-25% during normal operation, then drops below 5% during an afterburner transient before adaptive control restores it. A static design-point calculation would never catch that swing—off-design simulation exists to expose it.
Aerospace, marine, power-generation, and university teams use the same component-level model for UAV propulsion studies, hybrid-electric research, and classroom labs.
Conclusion
Off-design performance analysis gives engineers control over how a gas turbine behaves across its real operating envelope, not just the narrow slice it was designed for. Component maps, matching equations, and validation against test data form the backbone of that process, whether you're working through it by hand or running it in real time.
Models age the same way engines do. As hardware degrades or configurations change, off-design models need continual validation and refinement against fresh test data to stay trustworthy.
Frequently Asked Questions
What does "off-design" mean in gas turbine performance?
Off-design refers to any operating condition, whether speed, load, altitude, or ambient temperature, that differs from the engine's original design specification point. Nearly all real-world operation falls into this category.
When is off-design analysis used in gas turbine work?
Engineers use it whenever the engine leaves the design point—part-load operation, extreme ambient temperatures, throttle transients, altitude changes, or checks after component degradation.
What are other terms for off-design analysis?
Engineers also use "part-load performance," "component matching," and "transient performance analysis." These terms overlap but emphasize different aspects of the same problem.
Why can't design-point analysis alone predict real engine behavior?
Compressor and turbine maps are nonlinear. Performance away from the design point requires iterative matching against those maps, not simple linear scaling.
How is off-design analysis validated against real engines?
Engineers compare simulated results against test-cell or field data. NASA's J85-GE-21 test data from the Lewis Research Center is a widely used benchmark for this validation.
What tools do engineers use for off-design analysis?
Options range from manual iterative matching to real-time simulation software. Tools like SimTurbo handle component matching and control-law validation without hand iteration.