Introduction
Compressor surge is one of the most violent aerodynamic phenomena in turbomachinery, capable of reversing massive airflows in fractions of a second. Engineers have long used complex equations and performance maps to predict when a compressor will cross the stability boundary.
Those tools define operating limits, but they cannot show the dynamic reality: pressure waves moving backward through the system, flow reversing, and operating points jumping across characteristic curves in real time.
Animation and interactive simulation make surge behavior visible. Instead of reading static surge lines on paper maps, engineers and students can watch the full surge cycle unfold.
You see how throttling drives an operating point toward instability, how the system jumps to reverse flow, and how pressure oscillations repeat until corrective action is taken. This guide breaks down centrifugal compressor surge with animated sequences and visual simulation so the physics is concrete, not abstract.
Key Takeaways:
- Surge is a system-wide aerodynamic instability causing violent flow oscillation and potential reversal
- Animation reveals dynamic pressure wave propagation and operating point movement that static maps cannot show
- The surge cycle includes four distinct phases: approach, instantaneous jump, flow reversal, and recovery
- Real-time simulation platforms enable engineers to test surge prevention strategies without endangering equipment
- SimTurbo’s component-based models show surge cycles developing on interactive graphs and compressor maps
What is Centrifugal Compressor Surge?
Compressor surge is an aerodynamic instability where flow oscillates violently in the axial direction, potentially reversing completely through the machine. Unlike localized flow disturbances, surge affects the entire compression system—compressor, ducting, plenum, and downstream piping—simultaneously.
Surge vs. Rotating Stall
These two instabilities are often confused, but they represent different phenomena:
- Surge: A system-wide, axisymmetric oscillation affecting all flow passages simultaneously; produces low-frequency pressure pulsations throughout the entire compression system
- Rotating Stall: A localized, circumferentially traveling flow distortion that affects individual blade passages while adjacent passages continue operating; rotates around the annulus at a fraction of rotor speed
Which instability occurs depends on system parameters. Above a critical value of the Greitzer parameter, the system produces large-amplitude surge; below it, rotating stall appears at lower flow and pressure ratio.
The Surge Line and Performance Maps
The surge line on a compressor performance map marks the boundary between stable and unstable operation. It appears as the left-hand boundary on a map of pressure ratio versus corrected mass flow, where individual speed lines end at this limit.
When the operating point reaches the surge line, the compressor can no longer overcome the downstream pressure gradient. The system becomes unstable, initiating the surge cycle.
How Surge Manifests
Surge produces distinctive physical signatures:
- Audible signature: Low-frequency thumping, honking, or "whooshing" as pressure pulsates; surge frequencies typically fall between 3.9 Hz and 12.0 Hz
- Severe pressure pulsations: Rapid pressure changes throughout the compression system, visible on pressure gauges as oscillating readings
- Mechanical vibration: Thrust loads reversing direction, radial vibration from unsteady aerodynamic forces, and structural response to pressure waves
- Flow meter reversals: Instantaneous changes in measured flow direction during deep surge events
Mild Surge vs. Deep Surge
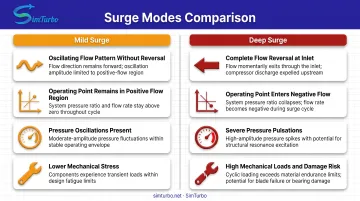
The classification depends on whether full flow reversal occurs:
- Mild surge: Pressure and flow oscillate but flow does not reverse direction at the compressor inlet; the operating point remains on the positive-flow portion of the characteristic curve
- Deep surge: Flow reverses completely at the compressor inlet each cycle; reversal phases can last 70 ms or more per surge period
Both types cause damage, but deep surge with full flow reversal imposes the most severe mechanical and aerodynamic loads on compressor components.
Understanding Surge Through Visualization and Animation
Static compressor maps show where surge occurs. Animation shows how surge develops, propagates, and repeats. That distinction matters for engineers who need to understand cause, effect, and prevention.
Why Animation Reveals What Static Diagrams Cannot
Surge is a time-dependent, dynamic phenomenon. A static map identifies the surge line boundary, but it cannot display:
- Pressure wave propagation through ducting and plenums
- The speed at which operating points jump from positive to negative flow
- How system volume, inertia, and downstream conditions influence cycle frequency
- The counterclockwise limit cycle traced by the operating point during repeated surge
- The relationship between compressor characteristic slope and system stability
Animation bridges this gap. Frame-by-frame views of pressure change, flow reversal, and operating-point motion give engineers a grasp of surge mechanics that equations alone rarely deliver.
What Engineers Should Look for in Surge Animations
Effective surge animations display multiple synchronized views:
- Compressor map with moving operating point: Tracks the approach to surge, jump to reverse flow, negative-slope path, and recovery
- Pressure history plots: Display plenum pressure rise and fall during each surge cycle
- Flow direction indicators: Visualize forward deceleration, reversal, and re-acceleration phases
- System schematic with flow vectors: Illustrate how flow reverses through the compressor, ducting, and downstream components
The most valuable animations reveal the cause-and-effect relationship between compressor characteristic curves and system response. A positive slope left of the surge line creates unstable positive feedback, forcing the instantaneous jump to reverse flow.
Real-Time Simulation Platforms Enable Interactive Visualization
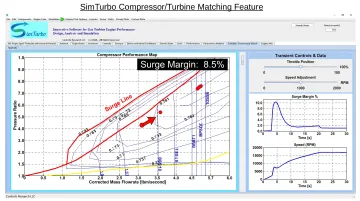
Beyond pre-rendered animations, real-time simulation platforms allow engineers to manipulate operating conditions and observe surge behavior interactively. By adjusting throttle position, speed, or downstream pressure during a running simulation, users can drive the operating point toward the surge line and watch the system response.
SimTurbo's real-time physics modeling enables this interactive approach. Engineers and students can:
- Monitor surge margin in real time (typically 20–25% in normal operation)
- Observe how rapid transients—such as afterburner ignition—can drive surge margin below 5%, triggering protective control responses
- Visualize fuel-flow modulation and nozzle-area adjustments that restore stability
- Export transient data (RPM, temperature, pressure, surge margin) to CSV or Excel for detailed post-processing
This component-based simulation makes abstract surge concepts tangible. Instead of treating the engine as a "black box," users see how compressor, combustor, turbine, nozzle, and control elements interact during surge events.
Educational Value for Engineering Programs
University courses traditionally teach surge through lecture slides showing static performance maps. Interactive animation transforms this into hands-on learning:
- Capstone projects: Students can simulate startup, slam-acceleration, and transient load changes that approach surge boundaries
- Laboratory exercises: Virtual experiments with surge prevention strategies—adjusting recycle valves, modifying control gains, testing different operating margins
- Control system validation: Testing FADEC logic and PID controllers against surge scenarios without risking physical hardware
- "What-if" exploration: Observing how component changes (intercoolers, recuperators, variable geometry) affect surge margin and system stability
Seeing surge develop in real time, with simultaneous graphs, maps, and control responses, builds engineering intuition faster than static problem sets alone.
The Surge Cycle: A Frame-by-Frame Breakdown
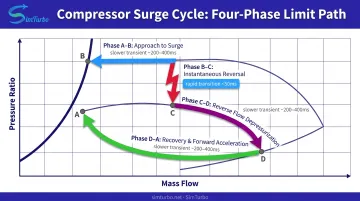
The surge cycle consists of four distinct phases. Understanding each phase clarifies why surge is self-sustaining once initiated and how control systems must intervene to break the cycle.
Let's examine each phase in sequence.
Point A to B: Approach to Surge (Forward Deceleration)
As downstream valves throttle closed or system demand decreases, the compressor operating point "walks left" along a constant-speed line toward lower mass flow rates. Pressure ratio increases as flow decreases, forcing the compressor to operate against an increasingly unfavorable pressure gradient.
During this phase:
- Inlet velocity and stage pressure rise gradually fall
- The operating point moves closer to the surge line
- The compressor remains stable but approaches the zero-slope peak of its characteristic curve
- Surge margin decreases, triggering warnings in modern control systems
The compressor continues stable operation until the operating point reaches the peak pressure rise—the point of zero slope on the characteristic curve.
Point B to C: The Jump (Instantaneous Transition)
At the zero-slope peak, the system becomes unstable. The positive slope immediately to the left creates positive feedback: any small flow decrease causes pressure rise to increase, which further decreases flow, which increases pressure rise again.
This unstable feedback loop causes the operating point to jump instantaneously to negative flow.
Key characteristics of this transition:
- Occurs in fractions of a second
- Timing depends on system geometry, volume, and inertia
- The operating point does not gradually slide into reverse flow
- Transition is abrupt from positive-flow to negative-flow characteristic
Point C to D: Flow Reversal Phase (Depressurization)
Once in reverse flow, the operating point follows the negative-slope portion of the compressor characteristic curve. High-pressure fluid stored in downstream plenums and ducting rushes backward through the compressor.
This reversal produces:
- Significant reverse flow at the compressor inlet
- Rapid discharge pressure drop as the system depressurizes
- Backward propagation of pressure waves
- High aerodynamic and mechanical loads on compressor blades
NASA high-speed testing observed diffuser pressure spikes, upstream rushes of high-pressure fluid, and reverse velocities during this phase. The reversal continues until system pressure drops sufficiently that forward flow can re-establish.
Point D to A: Recovery and Cycle Repetition (Forward Acceleration)
As discharge pressure falls, the pressure gradient reverses. Forward flow accelerates, inlet velocity rapidly rises, and pressure rise partially recovers. The operating point jumps back from the negative-flow characteristic to the positive-flow region, completing one surge cycle.
If throttle position and system conditions remain unchanged, the cycle immediately repeats. The operating point traces a counterclockwise limit cycle on the compressor map—approach, jump to reverse flow, depressurization, recovery, approach again. This creates the characteristic low-frequency oscillation (typically 4-12 Hz) and repetitive audible signature.
The cycle continues indefinitely until one of the following interventions occurs:
- Downstream valves open to increase flow demand
- Compressor speed decreases to move the operating line away from surge
- Anti-surge recycle valves open to maintain minimum forward flow
- The compressor is shut down
Consequences and Warning Signs of Compressor Surge
Surge slams the machine with reversing aerodynamic and mechanical loads that cut performance and can destroy hardware in a few cycles.
Mechanical Damage from Surge
Each surge cycle produces:
- Thrust bearings overloaded as axial loads reverse again and again on hardware built mainly for forward thrust
- Blade-root fatigue from pressure shock and reverse bending, matching fractures seen after repeated surge and stall
- High blade stress during reversed flow, with risk of flutter and aeroelastic coupling in the blow-down phase
- Abnormal radial vibration as unsteady aero forces and pressure pulsations excite structural modes
- Efficiency drop after even brief events—documented cases showed ~20°C EGT rise and 2.5% speed increase before final failure
Observable Warning Signs
Engineers can detect approaching or active surge through:
- Deep booming or thumping at surge frequency (about 4–12 Hz), often with higher-frequency noise (30–85 Hz) on top of the cycle
- Visible pulsations on discharge and plenum pressure gauges
- Flow-meter reversals in deep surge, including negative flow readings
- Vibration spikes at surge-cycle frequencies on accelerometers and casing sensors
- Exhaust gas temperature rise as compressor efficiency falls
Modern instrumentation monitors dynamic pressure, temperature, and acoustic noise continuously for surge-point identification and early warning.
Why Prevention Is Critical
Even a few surge cycles can cause measurable performance degradation in axial compressors. For centrifugal machines, repeated surge accelerates bearing wear, degrades seal integrity, and fatigues blades. Industrial turbocharger manufacturers direct operators to stop and inspect the compressor wheel for damage after any surging event.
Damage is not limited to the compressor. In gas turbine engines, surge can trigger power loss, flameout, and large inlet or nacelle pressure transients that threaten aircraft safety or plant stability. Catching the warning signs early is what keeps a few cycles from becoming a teardown.
Surge Control and Prevention Strategies
Preventing surge requires real-time monitoring and fast, coordinated control actions.
Instrumentation Approach
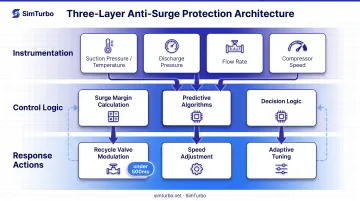
Surge controllers continuously monitor:
- Suction pressure and temperature to calculate corrected flow and inlet conditions
- Discharge pressure with suction data to find pressure ratio and map position
- Flow rate via differential-pressure transmitters on an orifice or venturi
- Compressor speed to identify which speed line the operating point occupies
Advanced controllers track how close the operating point sits to the surge control line (a boundary offset from the true surge line by a safety margin). Controllers should sample process variables at least 20 times per second so rapid flow changes are caught in time.
Primary Control Methods
1. Recycle Valve Modulation (Anti-Surge Valves)
Anti-surge valves recycle discharge flow to the compressor inlet—or vent it to atmosphere—so forward flow stays above the minimum. When the operating point nears or crosses the surge control line, the valve:
- Opens rapidly (logic execution target ≤100 ms; total response under 500 ms)
- Raises compressor flow by recycling gas
- Shifts the operating point right on the map, away from the surge line
- Ramps closed gradually once a safe margin is restored
Some systems add derivative logic that opens the valve during a rapid flow decline before the point hits the control line, giving predictive protection.
2. Compressor Speed Adjustment
Reducing compressor speed moves the operating line down and left, often away from the surge boundary. Speed control works well for:
- Gradual load changes when response time allows
- Variable-speed drivers (gas turbines, electric motors with VFDs)
- Coordinated strategies that pair speed reduction with valve modulation
Speed changes are slower than valve response, so recycle valves remain the primary defense against fast transients.
Maintaining Adequate Surge Margin
Surge margin is the flow separation between the operating line and the compressor stability limit, usually stated as a percent offset from the surge line.
Industrial anti-surge guidelines commonly call for a minimum 10% flow margin between the control line and the actual surge line. That buffer covers measurement uncertainty, map variation, and transient overshoot.
On gas turbine engines, acceptable margins also depend on mission profile and how fast the control system can react. Active methods such as diffuser air injection have shown surge-margin gains around 15% over baseline in research settings, but those results are technology-specific—not universal design rules.
Effective modern anti-surge systems combine three capabilities:
- Sub-500 ms loops from surge detection through valve motion
- Predictive logic (derivative action, rate-of-change checks, model-based forecasts) that acts before surge starts
- Adaptive tuning that adjusts parameters for operating condition, ambient air, and measured performance
Off-the-shelf anti-surge controllers model the surge-limit line, blend closed- and open-loop response, and coordinate with load-sharing and process control. Engineers often prove those strategies in transient simulation—using tools such as SimTurbo—before committing valve sizing, margins, and logic to hardware.
Frequently Asked Questions
What is compressor surge (and choking) and what causes it?
Surge occurs when a compressor cannot overcome downstream pressure, causing flow oscillation and possible reversal. Choking is the opposite high-flow limit, where Mach effects and losses stop flow from rising further even as pressure ratio drops. Common causes include excessive throttling, rapid system pressure changes, and operation outside the stable map region between the surge and choke lines.
What does compressor surge sound like?
Surge produces a low-frequency thumping or honking sound from rapid system-wide pressure pulsations. The repetitive whooshing or banging usually tracks the surge cycle at about 4–12 Hz, often with higher-frequency noise layered on top of that fundamental pulse.
Is compressor surge harmful to a turbocharger?
Yes. Surge drives thrust-bearing wear from reversing axial loads, blade fatigue from reverse bending and pressure shocks, seal damage from flow reversal, and progressive efficiency loss. Even brief events can force costly repairs, so manufacturers tell operators to stop immediately and inspect the compressor wheel before returning to service.
How can engineers visualize surge before it happens in real equipment?
Simulation software and surge animations let engineers study unstable behavior before it appears on real hardware. Real-time tools such as SimTurbo let you move throttle, speed, and control settings while watching the map, surge margin, and operating point, so you can test anti-surge strategies without risking equipment.
What's the difference between a surge animation and a compressor map?
A compressor map shows static operating regions—speed lines, efficiency islands, and surge/choke boundaries—but not how those points change with time. A surge animation shows the full dynamic cycle: the operating point approaching surge, reverse flow, pressure oscillation, and recovery back to stable positive flow.
Can surge be completely prevented in all operating conditions?
Steady operation inside the stable map region, with proper anti-surge controls, can prevent surge. Transients such as startup, emergency shutdown, rapid load changes, and slam acceleration can still push the operating point toward the boundary faster than controls react. Fast valves, limited ramp rates, and continuous surge-margin monitoring make avoidance possible, but only with coordinated real-time control.
Ready to visualize compressor surge in real time? SimTurbo lets you explore surge behavior, test control strategies, and watch system dynamics on live performance graphs. Start a free 30-day trial or book a 30-minute demo at SimTurbo.net, or call (779) 390-4786.