Engineers need reliable calculation methods to optimize turbine performance and detect degradation early. Whether you're designing a new engine, troubleshooting an underperforming unit, or teaching thermodynamics, understanding the factors, formulas, and tools behind efficiency calculations is critical.
Key Takeaways
- Thermal and combustion efficiency show how much fuel energy becomes usable mechanical work
- Brayton Cycle math links pressure ratio, turbine inlet temperature, and component losses to performance
- Ambient temperature can reduce efficiency by approximately 0.06% per °C above ISO conditions
- Pair thermodynamic formulas with simulation tools to validate results and optimize designs faster
- SimTurbo supports component-based modeling and validates efficiency within ±2% of NASA test data
What Is Gas Turbine Efficiency?
Gas turbine efficiency is the ratio of useful work output to the energy input from fuel. ISO 2314:2009 defines thermal efficiency as output power divided by fuel heat consumption on a lower heating value (LHV) basis. This metric tells you how much of the fuel's chemical energy becomes mechanical work.
Two Types of Efficiency
Thermal efficiency measures the overall energy conversion based on Brayton Cycle thermodynamics. It accounts for compression, combustion, expansion, and heat rejection stages.
Combustion efficiency measures how completely fuel burns in the combustion chamber. The National Academies reports current aircraft combustion systems exceed 99% efficiency, meaning nearly all fuel converts to heat. Only a fraction of that heat becomes useful work.
Where Efficiency Calculations Matter
Engineers use these calculations in:
- Power plant operations to monitor performance and schedule maintenance
- Aircraft propulsion design to optimize fuel consumption
- Marine turbine optimization to reduce operating costs
- Engineering education to teach thermodynamic principles
The Brayton Cycle Foundation
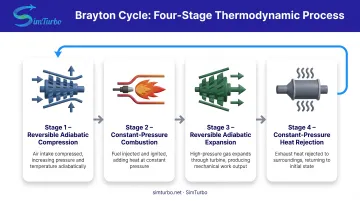
The Brayton Cycle is the thermodynamic model behind gas turbine operation. It has four stages:
- Reversible adiabatic compression – air pressure and temperature increase
- Constant-pressure combustion – fuel burns, adding heat at high pressure
- Reversible adiabatic expansion – hot gases expand through turbine, producing work
- Constant-pressure heat rejection – exhaust releases unused heat to the atmosphere
Real-world gas turbines never achieve ideal Brayton Cycle efficiency due to mechanical losses, heat losses, friction, and component inefficiencies. Bridging that gap means using calculation methods that account for real component losses, not ideal-cycle estimates alone.
Why Gas Turbine Efficiency Calculation Matters
Efficiency calculations directly impact operational profitability. While general industry figures vary widely, the Rolls-Royce Trent XWB-84 EP shows that a 1.8% efficiency improvement saves about $450,000 per aircraft per year. In large power plants, similar gains can save millions annually in fuel costs.
Accurate calculations help engineers act before small losses become expensive problems. GE reports 2-6% degradation during the first 24,000 operating hours if degraded parts aren't replaced, versus 1-1.5% when they are.
With reliable efficiency data, teams can:
- Prevent costly failures by catching inefficiencies early
- Time component replacements to match real performance trends
- Justify capital upgrades with clear ROI numbers
Design and Simulation Applications
The same math shapes new designs, not just operating fleets. Efficiency calculations guide:
- Component selection for new turbine designs
- System architecture choices (simple cycle vs. combined cycle)
- Performance predictions across operating conditions
- Virtual prototyping before physical testing
EPRI emphasizes that monitoring combustion-turbine component performance shows which engine portion drives an observed change. That focus supports targeted fixes instead of expensive blanket overhauls.
Key Factors Affecting Gas Turbine Efficiency
Multiple interrelated factors determine overall efficiency. Each one changes the inputs you use in Brayton-cycle and heat-rate calculations, so treating them explicitly keeps performance predictions realistic.
Compression Ratio
Compression ratio—the ratio of compressor discharge pressure to inlet pressure—is one of the most critical parameters. The ideal Brayton Cycle formula shows that higher pressure ratios generally improve thermal efficiency:
η = 1 - (1/r^((γ-1)/γ))
Where:
- η = thermal efficiency
- r = pressure ratio
- γ = specific heat ratio (approximately 1.4 for air)
Higher ratios improve efficiency but require more robust materials and advanced cooling. Aeroderivative units often run higher pressure ratios than heavy-duty industrial frames, but maps still vary by model. Use the OEM datasheet for the ratio and efficiency curves that apply to your machine.
Turbine Inlet Temperature (TIT)
TIT directly impacts energy extraction efficiency. Higher temperatures allow greater energy conversion but demand advanced cooling technologies and heat-resistant materials.
For example, Mitsubishi's M501J/JAC specifies 1600°C TIT and achieves 42.1% and 44.0% simple-cycle LHV efficiencies, respectively. The DOE ARPA-E ULTIMATE program targets TIT of 1800°C or higher for up to 7% efficiency improvement—though these remain research goals, not current fleet performance.
Ambient Conditions
Ambient temperature and air density affect compressor performance and overall efficiency. Higher ambient temperatures reduce air density, decreasing mass flow and power output.
ISO 2314:2009 establishes standard reference conditions:
- Temperature: 15°C
- Pressure: 101.325 kPa
- Relative humidity: 60%
A 2021 peer-reviewed study found that ambient temperature reduced gas-turbine power by up to 22% and thermal efficiency by about 0.06% per °C above ISO conditions. Efficiency calculations must account for site-specific ambient conditions—altitude, temperature, and humidity—to produce accurate predictions.
Mechanical and Aerodynamic Losses
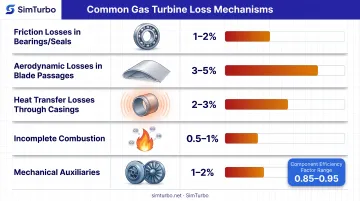
Common loss mechanisms include:
- Friction in bearings and seals
- Aerodynamic losses in blade passages
- Heat transfer losses through casings and ducting
- Incomplete combustion indicated by CO or unburned hydrocarbons in exhaust
These losses reduce real-world efficiency below theoretical values. NASA reports combustor pressure decreases only 1-2% during burning, but even small losses compound across components. Build component efficiency factors into the calculation—often about 0.85–0.95 depending on design and operating point.
Per GE performance guidance, compressor fouling is usually recoverable with washing. Increased clearances and degraded surface finish cut component efficiency and typically require part replacement. Folding these derates into cycle analysis is what separates nameplate efficiency from site-predicted heat rate.
How Gas Turbine Efficiency Calculation Works – Step by Step
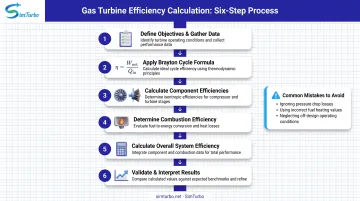
Theoretical formulas come from thermodynamics, but practical efficiency calculation needs systematic data collection, correct equations, and validation against real performance. Follow the six steps below—from defining objectives to interpreting results.
Step 1 – Define Calculation Objectives and Gather Input Data
Identify your efficiency metric:
- Overall thermal efficiency?
- Component efficiency (compressor, turbine, combustor)?
- Combustion efficiency?
Define the purpose:
- Design validation
- Performance monitoring
- Troubleshooting
List required input data:
- Compressor inlet conditions (pressure, temperature)
- Compressor pressure ratio
- Turbine inlet temperature
- Fuel flow rate and heating value (LHV or HHV)
- Exhaust conditions (temperature, pressure)
- Component efficiency factors (if known)
ISO 2314:2009 requires accounting for all streams crossing the test boundary, including fuel, air, and auxiliary power.
Step 2 – Apply the Brayton Cycle Thermal Efficiency Formula
The ideal Brayton Cycle thermal efficiency provides the theoretical maximum:
η = 1 - (1/r^((γ-1)/γ))
Where:
- r = pressure ratio (typically 15:1 to 30:1 depending on design)
- γ = specific heat ratio (approximately 1.4 for air)
This formula shows that efficiency increases with pressure ratio, but it excludes real-world losses. Use it as a sanity check, not a measured result.
Step 3 – Calculate Component Efficiencies
Compressor efficiency:
NASA defines compressor work as:
CW = cp × Tt2 × [(CPR^((γ-1)/γ)) - 1] / η_c
Where:
- CW = compressor work
- cp = specific heat at constant pressure
- Tt2 = compressor inlet total temperature
- CPR = compressor pressure ratio (pt3/pt2)
- η_c = compressor efficiency
Turbine efficiency:
TW = η_t × cp × Tt4 × [1 - TPR^((γ-1)/γ)]
Where:
- TW = turbine work
- η_t = turbine efficiency
- Tt4 = turbine inlet total temperature
- TPR = turbine pressure ratio (pt5/pt4)
Step 4 – Determine Combustion Efficiency
Combustion efficiency:
η_combustion = (actual heat released) / (theoretical fuel heating value)
NASA provides an emissions-based check:
η_b(%) = 100 - HC_EI/10 - CO_EI/42.5
Where HC_EI and CO_EI are hydrocarbon and carbon monoxide emission indices. Incomplete combustion (indicated by CO or unburned hydrocarbons) reduces this efficiency. NASA tests report >99% combustion efficiency over most conditions, but as low as 92.4% at idle for some configurations.
Step 5 – Calculate Overall System Efficiency
The overall efficiency formula combines component efficiencies:
η_overall = (net power output) / (fuel energy input)
ISO 2314 defines this as output power divided by LHV fuel heat consumption. Calculate net power as turbine work minus compressor work, then subtract auxiliary loads (fuel and oil pumps, cooling fans, and similar accessories) when your test boundary calls for shaft or electrical output.
Step 6 – Validate and Interpret Results
Validation methods:
- Compare against manufacturer specifications
- Check historical performance data
- Use industry benchmarks for similar configurations
- Review against NASA test data or published case studies
Error identification:
- Results outside expected ranges (e.g., >60% simple-cycle efficiency)
- Inconsistencies between component and overall efficiency
- Values that don't align with operating conditions
- Mixing LHV and HHV without documentation
For example, GE's LM6000 reports over 40% simple-cycle thermal efficiency. If your calculation for a similar engine shows 25% or 55%, investigate data quality and formula application.
Common Mistakes to Avoid
- Neglecting ambient condition corrections
- Using incorrect gas properties (LHV vs. HHV)
- Failing to account for component degradation
- Misapplying efficiency factors from different engines or operating points
- Mixing LHV and HHV results without clear documentation
Example Calculation Walkthrough
Let's walk through a simplified calculation with representative values. These figures are for education only—use actual test data or manufacturer specs on real projects.
Given:
- Compression ratio: 20:1
- Turbine inlet temperature: 1400°C (1673 K)
- Compressor inlet: 15°C (288 K), 1 atm
- Fuel heating value (LHV): 50 MJ/kg
- Specific heat ratio (γ): 1.4
Step 1: Calculate ideal Brayton efficiency
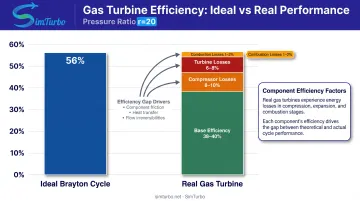
η_ideal = 1 - (1/r^((γ-1)/γ)) η_ideal = 1 - (1/20^((1.4-1)/1.4)) η_ideal = 1 - (1/20^0.286) η_ideal ≈ 1 - 0.44 = 0.56 or 56%
Only compression ratio and γ enter this closed-form ideal result. Inlet temperature, TIT, and LHV show up when you move to a station-by-station energy balance.
Step 2: Apply realistic component efficiency factors
Using example component efficiencies (always verify for your specific engine):
- Compressor efficiency: 0.87
- Turbine efficiency: 0.90
- Combustion efficiency: 0.98
Unlike Step 1, real efficiency is not a single formula. Each component η feeds compressor, burner, and turbine enthalpy balances. A full station-by-station pass using NASA's compressor, combustor, and turbine equations typically lands near 38–40% overall for this cycle class.
Key insights:
- Ideal Brayton at r = 20 is ~56%; real hardware for this setup often lands near 38–40%
- Compressor and turbine losses drive most of that gap; combustor η is usually a smaller hit
- Bad inlet conditions or LHV skew heat input and net work right away
- Component-based simulation runs the station balances and flags inconsistent assumptions
SimTurbo's component-based modeling lets engineers build these balances step by step, watch the thermodynamics in real time, and check results against benchmarks such as the NASA J85-GE-21 test data (±2% accuracy).
How SimTurbo Supports Efficiency Calculation
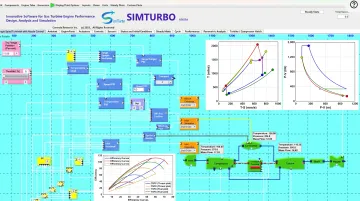
SimTurbo is a Windows-based gas turbine simulation platform for real-time, component-based efficiency calculations. Engineers and students build full engine models instead of applying station-by-station formulas by hand.
Drag-and-drop components include:
- Inlets, compressors, combustors, and turbines
- Nozzles, shafts, recuperators, intercoolers, and afterburners
Key Advantages for Efficiency Calculation
Real-time thermodynamic visualization
- Live T–S and P–V diagrams track compression, heat addition, expansion, and entropy as conditions change
- Thermal efficiency and TSFC plots vs. corrected speed (documented ranges: 0.1–0.5 efficiency; 0.48–2.40 lb/hp/hr TSFC from 4,000–20,000 RPM)
Validated accuracy
- Thermodynamic models checked against NASA Lewis J85-GE-21 test data within ±2% for thrust, flow, temperature, and TSFC
- Uses standard thermo relations, real-gas effects, compressor/turbine maps, and pressure-loss models
Practical workflow benefits
- Skips manual station-by-station math while keeping component behavior visible
- Exports time-series data to Excel, MATLAB, or Python
- Evaluates off-design points across altitude, Mach, and ambient temperature
- Simulates transients: startup, throttle changes, and compressor surge
Specific Use Cases
Design teams
- Compare compressor/turbine layouts, pressure ratios, and TIT to hit target efficiency
- Assess advanced cycles: recuperated, regenerative, and intercooled
Maintenance engineers
- Model degradation to forecast efficiency loss
- Track surge margin (example: 20–25% normal, below 5% in afterburner transients, then restored by adaptive control)
University students
- See how design changes move efficiency without physical test rigs
- Study Brayton-cycle analysis, component matching, transients, and control response
SimTurbo offers a 30-day free trial, with monthly licenses at $59.99, one-year at $599, and lifetime at $5,999. Discounted academic programs are available for classroom and research use.
Conclusion
Accurate gas turbine efficiency calculation underpins better performance, lower operating costs, and clearer design choices in power generation, aerospace, and marine work. The thermodynamics still rest on the Brayton Cycle, but modern practice pairs classical formulas with simulation tools that capture real-world component behavior and system losses.
Engineers must account for compression ratios, turbine inlet temperatures, ambient conditions, and component losses. Small gains compound fast: the Rolls-Royce Trent XWB-84 EP’s 1.8% fuel reduction saves about $450,000 per aircraft each year.
As programs such as DOE’s ULTIMATE push toward 1800°C TIT and up to 7% efficiency gains, reliable cycle math and simulation matter more than ever. Tools like SimTurbo help engineers model steady-state performance, match components, and test design trade-offs before hardware is built.
Frequently Asked Questions
What is the efficiency of a gas turbine?
Modern gas turbines reach 30–40% thermal efficiency in simple cycle—GE's LM6000 exceeds 40%—measured as work output over fuel energy input (LHV). Combined cycle plants can exceed 60% by recovering exhaust heat.
What is the difference between thermal efficiency and combustion efficiency in gas turbines?
Thermal efficiency measures how effectively the turbine converts heat energy into mechanical work, based on the Brayton thermodynamic cycle. Combustion efficiency measures how completely fuel burns in the combustion chamber. The National Academies reports current aircraft combustors exceed 99% combustion efficiency, while whole-engine thermal efficiency is much lower (30-40% simple cycle).
How do you calculate the thermal efficiency of a gas turbine?
Use the Brayton Cycle formula η = 1 - (1/r^((γ-1)/γ)) for ideal efficiency, where r is pressure ratio and γ is specific heat ratio. Practical calculations must also account for compressor, turbine, and combustion efficiencies, plus mechanical losses. ISO 2314 defines measured efficiency as output power divided by LHV fuel heat input.
Why does ambient temperature affect gas turbine efficiency?
Higher ambient temperatures reduce air density, which decreases the mass flow through the compressor and reduces overall power output and efficiency. A 2021 study found that ambient temperature can reduce power by up to 22% and thermal efficiency by about 0.06% per °C above ISO reference conditions (15°C).
What is a typical compression ratio for gas turbines and how does it affect efficiency?
Industrial gas turbines typically run about 10–20:1; aeroderivative units often reach 20–40:1. Higher pressure ratios raise Brayton-cycle thermal efficiency but need advanced materials and cooling—confirm exact values on OEM datasheets.
Can gas turbine efficiency be improved after installation?
Yes—common options include inlet air cooling, compressor cleaning, blade coating upgrades, tighter combustion control, and heat recovery (combined cycle). GE reports that replacing degraded parts limits degradation to 1–1.5% versus 2–6% without replacement.